
Page 28 - Recognizing axial spondyloarthritis - Janneke de Winter
P. 28
CHAPTER TWO
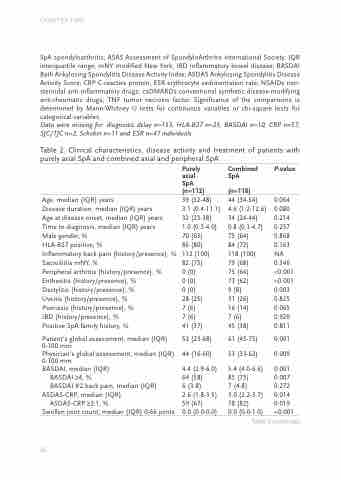
SpA spondyloarthritis; ASAS Assessment of SpondyloArthritis international Society; IQR interquartile range; mNY modified New York; IBD inflammatory bowel disease; BASDAI Bath Ankylosing Spondylitis Disease Activity Index; ASDAS Ankylosing Spondylitis Disease Activity Score; CRP C-reactive protein; ESR erythrocyte sedimentation rate; NSAIDs non- steroidal anti-inflammatory drugs; csDMARDs conventional synthetic disease-modifying anti-rheumatic drugs; TNF tumor necrosis factor. Significance of the comparisons is determined by Mann-Whitney U tests for continuous variables or chi-square tests for categorical variables.
Data were missing for: diagnostic delay n=153, HLA-B27 n=25, BASDAI n=10, CRP n=57, SJC/TJC n=2, Schober n=11 and ESR n=47 individuals
Table 2. Clinical characteristics, disease activity and treatment of patients with purely axial SpA and combined axial and peripheral SpA
Age, median (IQR) years
Disease duration, median (IQR) years
Age at disease onset, median (IQR) years Time to diagnosis, median (IQR) years
Male gender, %
HLA-B27 positive, %
Inflammatory back pain (history/presence), % Sacroiliitis mNY, %
Peripheral arthritis (history/presence), % Enthesitis (history/presence), %
Dactylitis (history/presence), %
Uveitis (history/presence), %
Psoriasis (history/presence), %
IBD (history/presence), %
Positive SpA family history, %
Patient's global assessment, median (IQR) 0-100 mm
Physician's global assessment, median (IQR) 0-100 mm
BASDAI, median (IQR)
BASDAI ≥4, %
BASDAI #2 back pain, median (IQR)
ASDAS-CRP, median (IQR) ASDAS-CRP ≥2.1, %
Swollen joint count, median (IQR) 0-66 joints
Purely axial SpA (n=112)
39 (32-48) 3.1 (0.4-11.1) 32 (23-38) 1.0 (0.3-4.0) 70 (63)
86 (80)
112 (100)
82 (73)
0 (0)
0 (0)
0 (0)
28 (25)
7 (6)
7 (6)
41 (37)
52 (23-68) 44 (16-60)
4.4 (2.9-6.0) 64 (58)
6 (3-8)
2.6 (1.8-3.5) 59 (67)
0.0 (0.0-0.0)
Combined SpA
(n=118)
44 (34-54) 4.6 (1.2-12.6) 34 (24-44) 0.8 (0.1-4.7) 75 (64)
84 (72)
118 (100)
79 (68)
75 (64)
73 (62)
9 (8)
31 (26)
16 (14)
7 (6)
45 (38)
61 (45-75) 53 (33-62)
5.4 (4.0-6.6) 85 (75)
7 (4-8)
3.0 (2.2-3.7) 78 (82)
0.0 (0.0-1.0)
P-value
0.064 0.080 0.214 0.257 0.868 0.163 NA 0.346 <0.001 <0.001 0.003 0.825 0.065 0.920 0.811
0.001 0.009
0.001 0.007 0.272 0.014 0.019 <0.001
26
Table 2 continues
