
Page 27 - Recognizing axial spondyloarthritis - Janneke de Winter
P. 27
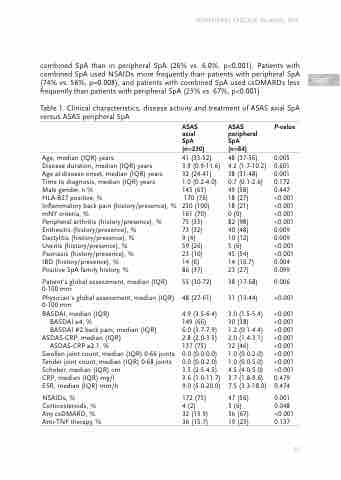
combined SpA than in peripheral SpA (26% vs. 6.0%, p<0.001). Patients with combined SpA used NSAIDs more frequently than patients with peripheral SpA (74% vs. 56%, p=0.008), and patients with combined SpA used csDMARDs less frequently than patients with peripheral SpA (23% vs. 67%, p<0.001).
Table 1. Clinical characteristics, disease activity and treatment of ASAS axial SpA versus ASAS peripheral SpA
PERIPHERAL DISEASE IN AXIAL SPA
    Age, median (IQR) years
Disease duration, median (IQR) years
Age at disease onset, median (IQR) years Time to diagnosis, median (IQR) years
Male gender, n %
HLA-B27 positive, %
Inflammatory back pain (history/presence), % mNY criteria, %
Peripheral arthritis (history/presence), % Enthesitis (history/presence), %
Dactylitis (history/presence), %
Uveitis (history/presence), %
Psoriasis (history/presence), %
IBD (history/presence), %
Positive SpA family history, %
Patient's global assessment, median (IQR) 0-100 mm
Physician's global assessment, median (IQR) 0-100 mm
BASDAI, median (IQR)
BASDAI ≥4, %
BASDAI #2 back pain, median (IQR)
ASDAS-CRP, median (IQR) ASDAS-CRP ≥2.1, %
Swollen joint count, median (IQR) 0-66 joints Tender joint count, median (IQR) 0-68 joints Schober, median (IQR) cm
CRP, median (IQR) mg/l
ESR, median (IQR) mm/h
NSAIDs, % Corticosteroids, % Any csDMARD, % Anti-TNF therapy, %
ASAS axial SpA (n=230)
41 (33-52) 3.9 (0.9-11.6) 32 (24-41) 1.0 (0.2-4.0) 145 (63)
170 (76) 230 (100) 161 (70) 75 (33) 73 (32)
9 (4) 59 (26) 23 (10) 14 (6) 86 (37)
55 (30-72) 48 (27-61)
4.9 (3.5-6.4) 149 (66)
6.0 (3.7-7.9) 2.8 (2.0-3.5) 137 (75)
0.0 (0.0-0.0) 0.0 (0.0-2.0) 3.5 (2.5-4.5) 3.6 (1.0-11.7) 9.0 (5.0-20.0)
172 (75) 4 (2)
32 (13.9) 36 (15.7)
ASAS peripheral SpA (n=84)
48 (37-56) 4.2 (1.7-10.2) 38 (31-48) 0.7 (0.1-2.6) 49 (58)
18 (27)
18 (21)
0 (0)
82 (98)
40 (48)
10 (12)
5 (6)
45 (54)
14 (16.7)
23 (27)
38 (17-68) 31 (13-44)
3.0 (1.5-5.4) 30 (38)
1.2 (0.1-4.4) 2.0 (1.4-3.1) 32 (46)
1.0 (0.0-2.0) 1.0 (0.0-5.0) 4.5 (4.0-5.0) 3.7 (1.8-9.6) 7.5 (3.3-18.0)
47 (56) 5 (6) 56 (67) 19 (23)
P-value
0.005 0.601 0.001 0.172 0.447 <0.001 <0.001 <0.001 <0.001 0.009 0.009 <0.001 <0.001 0.004 0.099
0.006
<0.001
<0.001 <0.001 <0.001 <0.001 <0.001 <0.001 <0.001 <0.001 0.479 0.474
0.001 0.048 <0.001 0.137
  25
 TWO
