
Page 96 - The SpeakTeach method - Esther de Vrind
P. 96
Chapter 4. Perspective of the students - adaptivity
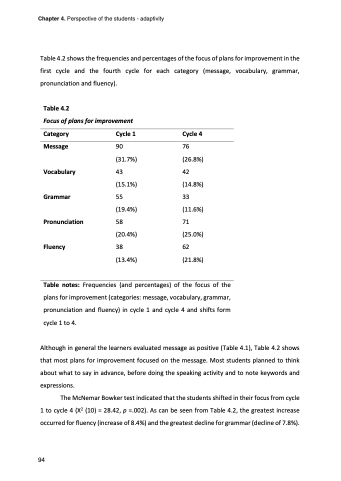
Table 4.2 shows the frequencies and percentages of the focus of plans for improvement in the first cycle and the fourth cycle for each category (message, vocabulary, grammar, pronunciation and fluency).
Table 4.2
Focus of plans for improvement
Category Message
Vocabulary Grammar Pronunciation Fluency
Cycle 1
90 (31.7%) 43 (15.1%) 55 (19.4%) 58 (20.4%) 38 (13.4%)
Cycle 4
76 (26.8%) 42 (14.8%) 33 (11.6%) 71 (25.0%) 62 (21.8%)
Table notes: Frequencies (and percentages) of
plans for improvement (categories: message, vocabulary, grammar, pronunciation and fluency) in cycle 1 and cycle 4 and shifts form cycle 1 to 4.
Although in general the learners evaluated message as positive (Table 4.1), Table 4.2 shows that most plans for improvement focused on the message. Most students planned to think about what to say in advance, before doing the speaking activity and to note keywords and expressions.
The McNemar Bowker test indicated that the students shifted in their focus from cycle 1 to cycle 4 (X2 (10) = 28.42, p =.002). As can be seen from Table 4.2, the greatest increase occurred for fluency (increase of 8.4%) and the greatest decline for grammar (decline of 7.8%).
the focus of the
94
94
