
Page 57 - Sentinel lymph node biopsy in oral cavity cancer - Inne J. den Toom
P. 57
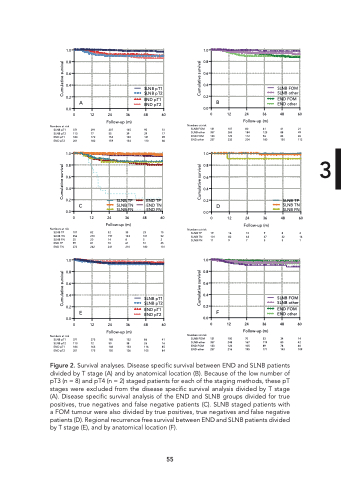
1.0 0.8 0.6 0.4 0.2 0.0 Numbers at risk SLNB pT1 SLNB pT2 END pT1 END pT2 1.0 0.8 0.6 0.4 0.2 0.0 Numbers at risk SLNB TP SLNB TN SLNB FN ENDTP END TN END FN 1.0 0.8 0.6 0.4 0.2 0.0 Numbers at risk SLNB pT1 SLNB pT2 END pT1 END pT2 1.0 0.8 0.6 SLNB pT1 0.4 SLNB pT2 SLNB FOM SLNB other END FOM END other A END pT1 0.2 B 0 12 24 36 48 60 01224364860 371 113 184 201 291 77 172 182 21 49 65 112 C SLNB TP SLNB TN SLNB FN Follow-up (m) 207 145 95 51 55392917 154 140 121 89 159 134 110 86 Follow-up (m) END pT2 0.0 Numbers at risk SLNB FOM 131 107 SLNB other 357 265 END FOM 133 125 END other 257 232 1.0 0.8 0.6 0.4 END TP 0.2 END TN D END FN 0.0 80 184 112 204 61 41 125 88 96 83 180 150 SLNB TP SLNB TN SLNB FN 012243648 60 0 12 Follow-up (m) 24364860 Follow-up (m) 10 9 84 107 356 25 99 272 19 82 270 20 81 262 14 52 35 197 143 14 8 70 61 241 210 5 5 Numbers at risk 23 15 SLNB TP 19 16 101 52 SLNB TN 101 82 E END pT1 0.2 F 0 12 371 273 113 72 184 163 201 175 24 36 48 60 Follow-up (m) 185 132 86 41 50382616 148 133 116 85 150 126 105 84 0 12 24 36 48 60 Follow-up (m) 5 2 51 45 180 131 2 1 63 47 32 16 SLNB FN 11 9 7 5 3 1 SLNB pT1 0.4 SLNB pT2 SLNB FOM SLNB other END FOM END other END pT2 0.0 Numbers at risk SLNB FOM SLNB other END FOM END other Figure 2. Survival analyses. Disease specific survival between END and SLNB patients divided by T stage (A) and by anatomical location (B). Because of the low number of pT3 (n = 8) and pT4 (n = 2) staged patients for each of the staging methods, these pT stages were excluded from the disease specific survival analysis divided by T stage (A). Disease specific survival analysis of the END and SLNB groups divided for true positives, true negatives and false negative patients (C). SLNB staged patients with a FOM tumour were also divided by true positives, true negatives and false negative patients (D). Regional recurrence free survival between END and SLNB patients divided by T stage (E), and by anatomical location (F). 55 1.0 0.8 0.6 131 100 70 357 248 167 133 124 105 257 216 195 533414 119 80 42 897860 171 143 109 3 Cumulative survival Cumulative survival Cumulative survival Cumulative survival Cumulative survival Cumulative survival
