
Page 50 - The value of total hip and knee arthroplasties for patients
P. 50
Chapter 3
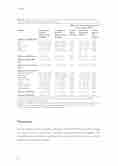
Table 2b. Change scores of clinical outcome measures in 271 patients undergoing Total Knee Ar throplasty (TKA) according to preoperative radiographic severity
Variable
Difference KOOS;mean
ADL
Pain
Quality of life Spor t Symptoms
Difference EQ5D score
Difference EQ5D VAS scale
Difference Oxford Knee Score
Difference SF36 Subscale
Physical Functioning Role Physical
Bodily Pain
General Health Vitality
Social Functioning Role Emotional Mental Health
Difference SF36 MCS Difference SF36 PCS
KL grade 0-2 (N=74)
Mean Change (95%CI)
33.2 (27.6; 39.4) 40.2 (33.9; 46.6) 13.8 (9.0; 18.9) 8.3 (3.6; 12.9) 27.6 (19.3; 36.9)
0.3 (0.2; 0.4) 10.7 (3.9; 17.8)
15.3 (12.7; 18.2)
31.5 (24.2; 39.6) 30.8 (17.9; 44.9) 32.0 (23.1; 40.9) -0.6 (-6.3; 5.0) 5.9 (0.6; 10.8) 16.3 (8.0; 25.0) 12.4 (-1.3; 24.4) 2.8 (-3.0; 8.4)
-0.4 (-3.9; 17.8) 10.8 (7.9; 13.9)
KL grade 3-4 (N=197) Mean Change (95%CI)
36.2 (32.7; 39.7) 43.5 (39.7; 47.0) 20.0 (17.0; 23.0) 9.5 (6.7; 12.4) 38.7 (33.8; 44.1)
0.2 (0.2; 0.3) 9.6 (6.6; 12.3)
15.9 (14.5; 17.1)
32.0 (27.9; 36.1) 31.3 (21.2; 40.0) 35.3 (31.0; 40.0) 1.7 (-1.0; 4.8) 9.1 (5.9; 12.2) 10.4 (5.7; 15.5) 5.1 (-1.8; 12.2) 1.9 (-0.6; 4.2)
-1.9 (-3.3; -0.5) 12.1 (10.4; 13.8)
P-value B (95% CI) Mann Multivariate Whitney Analysis
0.587 -0.8 (-5.7; 4.1) 0.737 -0.8 (-5.7; 4.2) 0.295 -1.5 (-6.1; 3.1) 0.597 -0.5 (-5.3; 4.3) 0.096 -6.7 (-14.8;
1.5)
0.095 0.0 (-0.0; 0.1)
0.733 1.4 (-2.7; 5.5) 0.318 -0.6 (-2.5; 1.3)
0.149 -3.2 (-9.4; 3.0) 0.727 4.8 (-5.8; 15.5) 0.550 -5.4 (-5.4; 7.5) 0.828 -1.1 (-5.7; 3.5) 0.937 0.5 (-4.1; 5.2) 0.780 3.7 (-2.4; 9.9) 0.109 5.9 (-3.9; 15.8) 0.434 1.8 (-2.5; 6.1)
0.357 1.5 (-1.1; 4.0) 0.201 -0.6 (-3.1; 2.0)
P-value Multivar- iate Analysis
0.743 0.757 0.523 0.834 0.108
0.489 0.496
0.557
0.315 0.369 0.739 0.639 0.827 0.235 0.237 0.403
0.249 0.667
Difference between change scores of KL 1-2 versus KL 3-4
* Comparison of patients with KL grade 0-2 and
Whitney U test. Significance level < 0.05.
KOOS= Knee disability and Osteoarthritis Outcome Score, EQ5D= Euroqol 5 Dimensional questionnaire; EQ5D-VAS scale= Euroqol 5 Dimensional Visual Analogue Scale; SF36= Shor t Form 36; MCS=Mental Component Summary Scale; PCS=Physical Component Scale
Discussion
This prospective study in patients undergoing THA and TKA showed that changes in scores over time were greater in patients with more severe radiographic OA. The difference was statistically significant for a number of clinical outcomes in THA patients, but not in TKA patients.
48
3-4 at preoperative assessment by means of Mann-
