
Page 49 - The value of total hip and knee arthroplasties for patients
P. 49
Outcome of total hip arthroplasty, but not of total knee arthroplasty, is related to the preoperative radiographic severity of osteoarthritis
scores between patients with KL 0–2 and patients with 3–4 for all of the PROMs
(Table 2a and 2b).
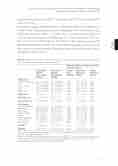
Adjusting for sex, age, preoperative scores of PROMs, and BMI (and Charnley score
in THA), in the THA group the severity of radiographic OA was related to 3 of 5
HOOS subscale scores (“ADL” (p = 0.002), “Pain” (p = 0.004), and “Symptoms” (p
= 0.004)), the SF subscale score “Bodily pain” (p = 0.004) and the SF “PCS” (p = 3 0.01), but not to the HOOS “Sports” and “Quality of life” subscale scores, the EQ
and EQ-VAS scales, the SF “MCS” and all the other SF subscales. In the TKA group, there was no association between radiographic severity and improvement in any of the PROMs (Table 2a and 2b).
Table 2a. Change scores of clinical outcome measures in 302 patients undergoing Total Hip Arthroplasty (THA) according to preoperative radiographic severity
Difference between change scores of KL 1-2 versus KL 3-4
HOOS; mean
Activities of Daily Living Pain
Quality of life
Spor t
Symptoms
EQ5D score EQ5D VAS scale Oxford Hip Score
SF36 Subscale
Physical Functioning Role Physical
Bodily Pain
General Health Vitality
Social Functioning Role Emotional Mental Health
SF36 MCS SF36 PCS
KL grade 0-2 (N=77)
Mean Change (95%CI)
36.1 (29.1; 42.8) 41.8 (35.1; 48.1) 18.1 (12.7; 24.2) 38.3 (29.0; 47.4) 34.8 (27.8; 41.9)
0.2 (0.1; 0.3) 11.6 (6.6; 17.0) 15.8 (13.3; 18.4)
26.4 (19.0; 34.0) 40.4 (28.8; 53.9) 28.0 (21.5; 34.7) 2.6 (-2.3; 7.5) 12.0 (6.8; 17.4) 14.9 (8.5; 21.6) 19.5 (4.9; 34.1) 7.1 (2.8; 11.4)
2.7 (-0.5; 5.8) 9.8 (7.1; 12.4)
KL grade 3-4 (N=225) Mean Change (95%CI)
42.3 (38.2; 45.8) 46.1 (42.2; 49.8) 22.4 (19.0; 25.6) 45.5 (40.3; 50.5) 45.7 (40.7; 50.7)
0.3 (0.2; 0.4) 13.6 (9.5; 17.6) 17.2 (15.4; 18.8)
36.5 (32.0; 40.9) 45.8 (37.4; 53.9) 40.4 (35.6; 44.8) 3.3 (0.2; 6.4) 12.4 (9.3; 15.7) 17.3 (12.7; 22.0) 19.9 (12.8; 27.2) 5.9 (3.5; 8.3)
1.2 (-0.6; 2.7) 13.7 (12.1; 15.2)
P-value B (95% CI) Mann Multivariate Whitney Analysis
0.096 -7.5 (-12.1;-2.8) 0.391 -6.1 (-10.2; -2.0) 0.059 -3.8 (-9.0; 1.4) 0.260 -4.2 (-11.9; 3.6) 0.023 -8.4 (-14.1; -2.6)
0.028 -0.1 (-0.1; 0.0) 0.532 -1.3 (-6.3; 3.7) 0.587 -2.0 (-4.2; 0.2)
0.026 -6.1 (-12.9; 0.7) 0.446 -8.4 (-18.9; 2.2) 0.006 -9.3 (-15.4;-3.1) 0.936 -2.7 (-7.6; 2.2) 0.639 -2.9 (-7.6; 1.8) 0.442 -3.8 (-9.7; 2.2) 0.504 -5.1 (-13.6; 3.5) 0.568 -1.1 (-4.7; 2.5)
0.224 0.3 (-1.9; 2.5) 0.012 -2.9 (-5.2; -7.2)
P-value Multivariate Analysis
0.002 0.004 0.153 0.290 0.004
0.052 0.598 0.068
0.076 0.120 0.004 0.280 0.220 0.211 0.244 0.549
0.793 0.010
* Comparison of patients with KL grade 0-2 and 3-4 at preoperative assessment by means of Mann- Whitney U test. Significance level < 0.05.
HOOS= Hip disability and Osteoarthritis Outcome Score, EQ5D= Euroqol 5 Dimensional questionnaire; EQ5D-VAS scale= Euroqol 5 Dimensional Visual Analogue Scale; SF36= Shor t Form 36; MCS=Mental Component Summary Scale; PCS=Physical Component Scale
47
