
Page 65 - Cellular Imaging in Regenerative Medicine, Cancer and Osteoarthritis
P. 65
Quantification of iron labeled cell
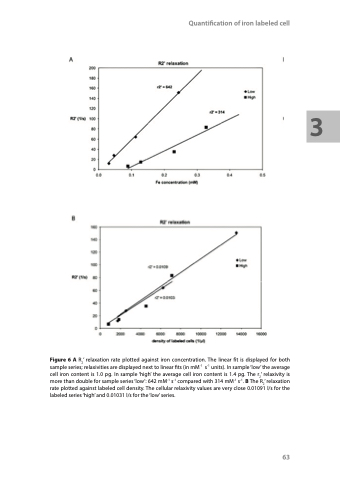
Figure 6 A R2’ relaxation rate plotted against iron concentration. The linear fit is displayed for both sample series; relaxivities are displayed next to linear fits (in mM-1 s-1 units). In sample ‘low’ the average cell iron content is 1.0 pg. In sample ‘high’ the average cell iron content is 1.4 pg. The r2’ relaxivity is more than double for sample series ‘low’: 642 mM-1 s-1 compared with 314 mM-1 s-1. B The R2’ relaxation rate plotted against labeled cell density. The cellular relaxivity values are very close 0.01091 l/s for the labeled series ‘high’ and 0.01031 l/s for the ‘low’ series.
63
3
