
Page 63 - Cellular Imaging in Regenerative Medicine, Cancer and Osteoarthritis
P. 63
Quantification of iron labeled cell
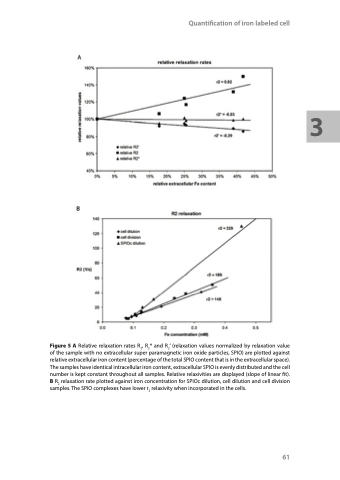
Figure 5 A Relative relaxation rates R2, R2* and R2’ (relaxation values normalized by relaxation value of the sample with no extracellular super paramagnetic iron oxide particles, SPIO) are plotted against relative extracellular iron content (percentage of the total SPIO content that is in the extracellular space). The samples have identical intracellular iron content, extracellular SPIO is evenly distributed and the cell number is kept constant throughout all samples. Relative relaxivities are displayed (slope of linear fit). B R2 relaxation rate plotted against iron concentration for SPIOc dilution, cell dilution and cell division samples. The SPIO complexes have lower r2 relaxivity when incorporated in the cells.
61
3
