
Page 60 - Cellular Imaging in Regenerative Medicine, Cancer and Osteoarthritis
P. 60
Chapter 3
relaxivity was calculated from relative relaxation rate vs relative extracellular iron content plots.
The R2' relaxation rate, as a physical quantity characterizing the B0 inhomogeneity was calculated as R2' = R2* – R2. Similarly, the relaxivity, characterizing the samples, was calculated as r2' = r2* – r2.
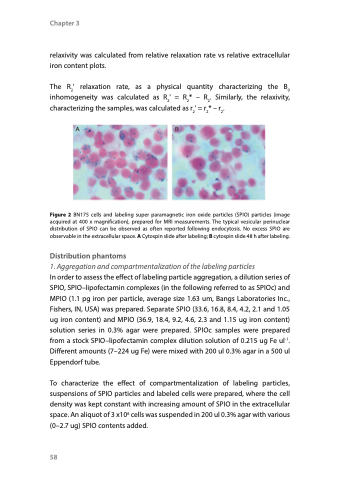
Figure 2 BN175 cells and labeling super paramagnetic iron oxide particles (SPIO) particles (image acquired at 400 x magnification), prepared for MRI measurements. The typical vesicular perinuclear distribution of SPIO can be observed as often reported following endocytosis. No excess SPIO are observable in the extracellular space. A Cytospin slide after labeling; B cytospin slide 48 h after labeling.
Distribution phantoms
1. Aggregation and compartmentalization of the labeling particles
In order to assess the effect of labeling particle aggregation, a dilution series of SPIO, SPIO–lipofectamin complexes (in the following referred to as SPIOc) and MPIO (1.1 pg iron per particle, average size 1.63 um, Bangs Laboratories Inc., Fishers, IN, USA) was prepared. Separate SPIO (33.6, 16.8, 8.4, 4.2, 2.1 and 1.05 ug iron content) and MPIO (36.9, 18.4, 9.2, 4.6, 2.3 and 1.15 ug iron content) solution series in 0.3% agar were prepared. SPIOc samples were prepared from a stock SPIO–lipofectamin complex dilution solution of 0.215 ug Fe ul-1. Different amounts (7–224 ug Fe) were mixed with 200 ul 0.3% agar in a 500 ul Eppendorf tube.
To characterize the effect of compartmentalization of labeling particles, suspensions of SPIO particles and labeled cells were prepared, where the cell density was kept constant with increasing amount of SPIO in the extracellular space. An aliquot of 3 x10⁶ cells was suspended in 200 ul 0.3% agar with various (0–2.7 ug) SPIO contents added.
58
