
Page 59 - Cellular Imaging in Regenerative Medicine, Cancer and Osteoarthritis
P. 59
SI = a . exp ( - b . TE) + c
where SI is the measured signal intensity and TE is echo time. The fitting parameters are a, b and c.
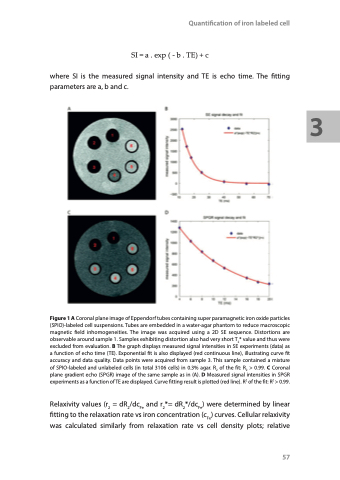
Figure 1 A Coronal plane image of Eppendorf tubes containing super paramagnetic iron oxide particles (SPIO)-labeled cell suspensions. Tubes are embedded in a water-agar phantom to reduce macroscopic magnetic field inhomogeneities. The image was acquired using a 2D SE sequence. Distortions are observable around sample 1. Samples exhibiting distortion also had very short T2* value and thus were excluded from evaluation. B The graph displays measured signal intensities in SE experiments (data) as a function of echo time (TE). Exponential fit is also displayed (red continuous line), illustrating curve fit accuracy and data quality. Data points were acquired from sample 3. This sample contained a mixture of SPIO-labeled and unlabeled cells (in total 3106 cells) in 0.3% agar. R2 of the fit: R2 > 0.99. C Coronal plane gradient echo (SPGR) image of the same sample as in (A). D Measured signal intensities in SPGR experiments as a function of TE are displayed. Curve fitting result is plotted (red line). R2 of the fit: R2 > 0.99.
Relaxivity values (r2 = dR2/dcFe and r2*= dR2*/dcFe) were determined by linear fitting to the relaxation rate vs iron concentration (cFe) curves. Cellular relaxivity was calculated similarly from relaxation rate vs cell density plots; relative
Quantification of iron labeled cell
57
3
