
Page 40 - Cellular Imaging in Regenerative Medicine, Cancer and Osteoarthritis
P. 40
Chapter 2
100 80 60 40 20
B
A 100 80 60 40 20 00
0 1000 2000 3000 FSC-A
4000 0 1000
6.25 ug MPIO 12.5 ug MPIO
2000 3000 4000 SSC-A
25 ug MPIO 50 ug MPIO
C
0 ug MPIO 3.13 ug MPIO
100 75 50 25
% alive
% of Max
% of Max
00 5 101520253035404550 ug MPIO/2ml/9.5cm2
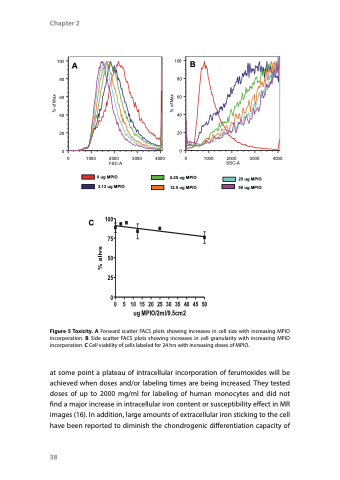
Figure 5 Toxicity. A Forward scatter FACS plots showing increases in cell size with increasing MPIO incorporation. B Side scatter FACS plots showing increases in cell granularity with increasing MPIO incorporation. C Cell viability of cells labeled for 24 hrs with increasing doses of MPIO.
at some point a plateau of intracellular incorporation of ferumoxides will be achieved when doses and/or labeling times are being increased. They tested doses of up to 2000 mg/ml for labeling of human monocytes and did not find a major increase in intracellular iron content or susceptibility effect in MR images (16). In addition, large amounts of extracellular iron sticking to the cell have been reported to diminish the chondrogenic differentiation capacity of
38
