
Page 170 - Demo
P. 170
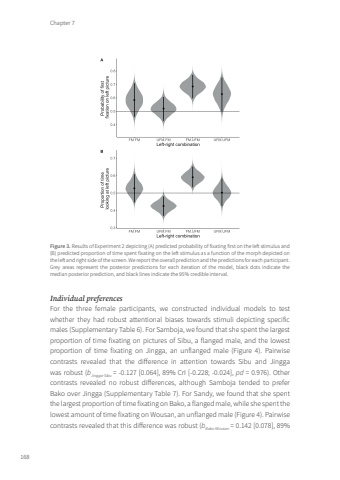
Chapter 7168Figure 3. Results of Experiment 2 depicting (A) predicted probability of fixating first on the left stimulus and (B) predicted proportion of time spent fixating on the left stimulus as a function of the morph depicted on the left and right side of the screen. We report the overall prediction and the predictions for each participant. Grey areas represent the posterior predictions for each iteration of the model, black dots indicate the median posterior prediction, and black lines indicate the 95% credible interval.Individual preferencesFor the three female participants, we constructed individual models to test whether they had robust attentional biases towards stimuli depicting specific males (Supplementary Table 6). For Samboja, we found that she spent the largest proportion of time fixating on pictures of Sibu, a flanged male, and the lowest proportion of time fixating on Jingga, an unflanged male (Figure 4). Pairwise contrasts revealed that the difference in attention towards Sibu and Jingga was robust (bJingga-Sibu = -0.127 [0.064], 89% CrI [-0.228; -0.024], pd = 0.976). Other contrasts revealed no robust differences, although Samboja tended to prefer Bako over Jingga (Supplementary Table 7). For Sandy, we found that she spent the largest proportion of time fixating on Bako, a flanged male, while she spent the lowest amount of time fixating on Wousan, an unflanged male (Figure 4). Pairwise contrasts revealed that this difference was robust (bBako-Wousan = 0.142 [0.078], 89% Tom Roth.indd 168 08-01-2024 10:42
