
Page 98 - Effective healthcare cost containment policies Using the Netherlands as a case study - Niek W. Stadhouders
P. 98
Chapter 4
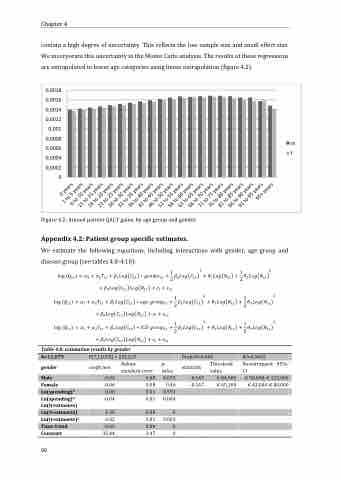
contain a high degree of uncertainty. This reflects the low sample size and small effect size. We incorporate this uncertainty in the Monte Carlo analysis. The results of these regressions are extrapolated to lower age categories using linear extrapolation (figure 4.2).
0,0018 0,0016 0,0014 0,0012
0,001 0,0008 0,0006 0,0004 0,0002
0
Figure 4.2: Annual patient QALY gains, by age group and gender
We estimate the following equations, including interactions with gender, age group and disease group (see tables 4.8-4.10):
m f
Appendix 4.2: Patient group specific estimates.
Table 4.8: estimation results by gender
elasticity Threshold Bootstrapped 95%- value CI
N=11,079
gender
-0.03 0.08
p- value
F(7,11078) = 2313.07
coefficient Robust standard error
2 Prob>F=0.000 R =0.9492
Male
Female -0.06 0.08
0.673 0.46 0.593 0.004
-0.145 € 84,900 € 58,000-€ 112,000 -0.167 € 65,100 € 43,000-€ 88,000
2
Ln(spending) 0.00 0.01
Ln(spending)* -0.04 0.01 Ln(treatments)
Ln(treatments) 1.30 0.08 Ln(treatments) 0.02 0.01 Time trend 2 -0.02 0.00 Constant 35.44 3.47
0 0.003 0 0
90
