
Page 96 - Effective healthcare cost containment policies Using the Netherlands as a case study - Niek W. Stadhouders
P. 96
Chapter 4
Appendix to Chapter 4
Appendix 4.1: Estimating gains in quality of life
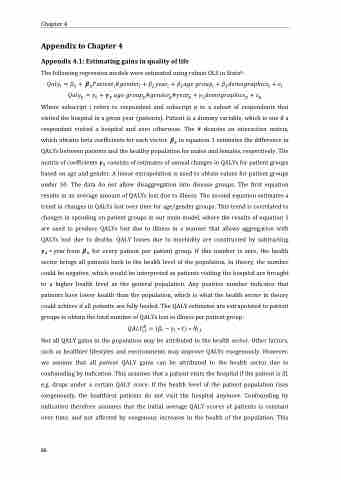
R The following regression models were estimated using robust OLS in Stata :
Where subscript i refers to respondent and subscript p to a subset of respondents that visited the hospital in a given year (patients). Patient is a dummy variable, which is one if a respondent visited a hospital and zero otherwise. The # denotes an interaction matrix, which obtains beta coefficients for each vector. in equation 1 estimates the difference in QALYs between patients and the healthy population for males and females, respectively. The matrix of coefficients consists of estimates of annual changes in QALYs for patient groups based on age and gender. A linear extrapolation is used to obtain values for patient groups under 50. The data do not allow disaggregation into disease groups. The first equation results in an average amount of QALYs lost due to illness. The second equation estimates a trend in changes in QALYs lost over time for age/gender groups. This trend is correlated to changes in spending on patient groups in our main model, where the results of equation 1 are used to produce QALYs lost due to illness in a manner that allows aggregation with QALYs lost due to deaths. QALY losses due to morbidity are constructed by subtracting
from for every patient per patient group. If this number is zero, the health sector brings all patients back to the health level of the population. In theory, the number could be negative, which would be interpreted as patients visiting the hospital are brought to a higher health level as the general population. Any positive number indicates that patients have lower health than the population, which is what the health sector in theory could achieve if all patients are fully healed. The QALY estimates are extrapolated to patient groups to obtain the total number of QALYs lost to illness per patient group:
Not all QALY gains in the population may be attributed to the health sector. Other factors, such as healthier lifestyles and environments may improve QALYs exogenously. However, we assume that all patient QALY gains can be attributed to the health sector due to confounding by indication. This assumes that a patient visits the hospital if the patient is ill, e.g. drops under a certain QALY score. If the health level of the patient population rises exogenously, the healthiest patients do not visit the hospital anymore. Confounding by indication therefore assumes that the initial average QALY scores of patients is constant over time, and not affected by exogenous increases in the health of the population. This
88
