
Page 132 - Effective healthcare cost containment policies Using the Netherlands as a case study - Niek W. Stadhouders
P. 132
Chapter 6
Success rates display a broad spread, ranging from 23.4% in Groningen to 40.6% at the VU Amsterdam. This appears unrelated to the number of treatments, ranging from 370 in Maastricht to 1825 in Rotterdam. Of all treatments, about two-thirds are estimated to be primary treatments.
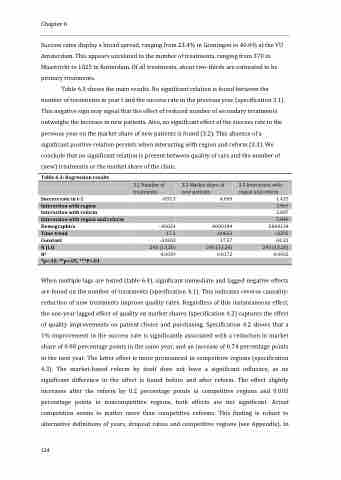
Table 6.3 shows the main results. No significant relation is found between the number of treatments in year t and the success rate in the previous year (specification 3.1). This negative sign may signal that the effect of reduced number of secondary treatments outweighs the increase in new patients. Also, no significant effect of the success rate in the previous year on the market share of new patients is found (3.2). This absence of a significant positive relation persists when interacting with region and reform (3.3). We conclude that no significant relation is present between quality of care and the number of (new) treatments or the market share of the clinic.
Table 6.3: Regression results
3.1 Number of 3.2 Market share of 3.3 Interaction with treatments new patients region and reform
-893.3 4.069 1.435 Interaction with region 3.967
Success rate in t-1
2.887 Interaction with region and reform 5.849 Demographics -.00024 .0000104 .0000134 Time trend 17.3 -.00623 -.0292 Constant -33303 17.57 63.31 N (i,t) 245 (13,20) 245 (13,20) 245 (13,20) R2 0.0039 0.0172 0.0032
Interaction with reform
*p<.10, **p<.05, ***P<.01
When multiple lags are tested (table 6.4), significant immediate and lagged negative effects are found on the number of treatments (specification 4.1). This indicates reverse causality: reduction of new treatments improve quality rates. Regardless of this instantaneous effect, the one-year lagged effect of quality on market shares (specification 4.2) captures the effect of quality improvements on patient choice and purchasing. Specification 4.2 shows that a 1% improvement in the success rate is significantly associated with a reduction in market share of 0.98 percentage points in the same year, and an increase of 0.74 percentage points in the next year. The latter effect is more pronounced in competitive regions (specification 4.3). The market-based reform by itself does not have a significant influence, as no significant difference in the effect is found before and after reform. The effect slightly increases after the reform by 0.2 percentage points in competitive regions and 0.005 percentage points in noncompetitive regions, both effects are not significant. Actual competition seems to matter more than competitive reforms. This finding is robust to alternative definitions of years, dropout ratios and competitive regions (see Appendix). In
124
