
Page 131 - Effective healthcare cost containment policies Using the Netherlands as a case study - Niek W. Stadhouders
P. 131
Do quality improvements in assisted reproduction technology increase patient numbers in a managed competition setting?
In total, we estimate three specifications: 1) estimation of the composite effect of quality on the number of treatments, 2) estimation of the effect of quality on new treatments only, 3) estimation of the effects of competitive regions and on competitive reforms.
As additional analyses, we include instantaneous effects and longer lag periods. Quality indicators are made available with a one-year time lag. This means that quality in year t cannot influence patient choice or purchasing in year t. However, instantaneous effects may occur due to reverse causality: by increasing the number of new treatments, quality of care may decline. Equivalently, quality of care may be improved by reducing the number of treatments. This effect could be caused by more strict guidelines and regulation supported by the government (Van den Boogaard, 2012). However, it also could potentially indicate cherry picking: by refusing patients with low chance of success, quality ratings may be improved. Thirdly, the effect could be caused by supplier-induced demand: treating more new patients –who have lower chances of success- reduces success rates in the same year. All three effects could result in reverse causality, which could justify adding instantaneous quality effects.
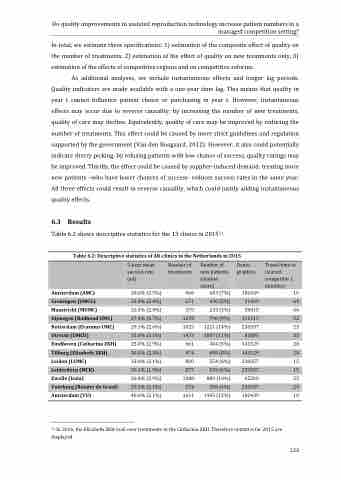
11 Table 6.2 shows descriptive statistics for the 13 clinics in 2015 .
6.3 Results
5-year mean Number of Number of Demo- Travel time to success rate treatments new patients graphics nearest
(sd) (market competitor (
Table 6.2: Descriptive statistics of AR-clinics in the Netherlands in 2015
share) minutes) 28.6% (2.5%) 966 643 (7%) 182439 10
Groningen (UMCG)
23.4% (2.4%) 671 430 (5%) 31469 64
Amsterdam (AMC) Maastricht (MUMC) Rotterdam (Erasmus UMC) Eindhoven (Catharina ZKH) Leiden (LUMC)
Zwolle (Isala) Amsterdam (VU)
11 In 2016, the Elisabeth ZKH took over treatments in the Catharina ZKH. Therefore statistics for 2015 are displayed
123
26.3% (2.4%) 370 233 (3%) 56815
27.4% (2.7%) 1278 790 (9%) 111513
29.1% (2.6%) 1825 1221 (14%) 230357
31.0% (3.1%) 1473 1007 (11%) 81895
25.0% (2.9%) 661 444 (5%) 141529
30.0% (2.3%) 974 698 (8%) 141529
33.0% (2.1%) 800 554 (6%) 230357
30.1% (1.9%) 877 549 (6%) 230357
26.4% (2.9%) 1388 889 (10%) 65200
29.3% (2.1%) 574 356 (4%) 230357
40.6% (2.1%) 1611 1105 (12%) 182439 10
66
52
23
33
28
28
15
15
55
23
Nijmegen (Radboud UMC)
Utrecht (UMCU)
Tilburg (Elisabeth ZKH)
Leiderdorp (MCK)
Voorburg (Reinier de Graaf)
