
Page 123 - Effective healthcare cost containment policies Using the Netherlands as a case study - Niek W. Stadhouders
P. 123
a)
10,0% 9,0% 8,0% 7,0% 6,0% 5,0% 4,0% 3,0% 2,0% 1,0% 0,0%
Do managed competition and active purchasing go hand in hand?
annual
structural
b)
4,0% 3,5% 3,0% 2,5% 2,0% 1,5% 1,0% 0,5% 0,0%
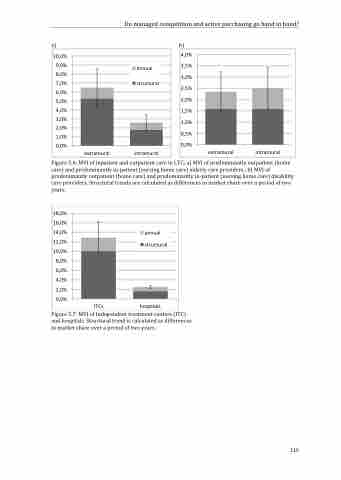
Figure 5.6: MVI of inpatient and outpatient care in LTC; a) MVI of predominantly outpatient (home care) and predominantly in-patient (nursing home care) elderly care providers.; b) MVI of predominantly outpatient (home care) and predominantly in-patient (nursing home care) disability care providers. Structural trends are calculated as differences in market share over a period of two years.
extramural intramural
extramural intramural
18,0% 16,0% 14,0% 12,0% 10,0%
8,0% 6,0% 4,0% 2,0% 0,0%
structural
annual
Figure 5.7: MVI of Independent treatment centers (ITC) and hospitals. Structural trend is calculated as differences in market share over a period of two years.
ITCs hospitals
115
