
Page 122 - Effective healthcare cost containment policies Using the Netherlands as a case study - Niek W. Stadhouders
P. 122
Chapter 5
4,0% 3,5% 3,0% 2,5% 2,0% 1,5% 1,0% 0,5% 0,0%
annual structural
including entry and exit excluding entry and exit
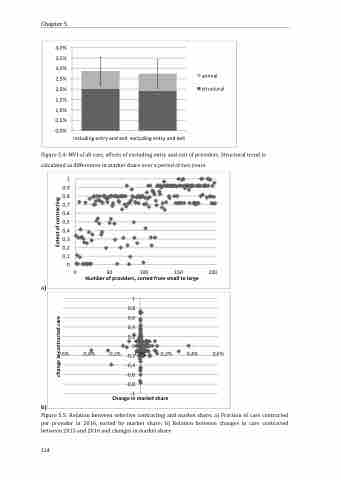
Figure 5.4: MVI of all care, effects of excluding entry and exit of providers. Structural trend is calculated as differences in market share over a period of two years.
1 0,9 0,8 0,7 0,6 0,5 0,4 0,3 0,2 0,1 0
0 50 100 150 200
Number of providers, sorted from small to large
1 0,8 0,6 0,4 0,2 0
-0,6% -0,4% -0,2% -0,20,0% 0,2% 0,4% 0,6%
-0,4 -0,6 -0,8
Change in market share
-1
a)
Figure 5.5: Relation between selective contracting and market share; a) Fraction of care contracted per provider in 2016, sorted by market share; b) Relation between changes in care contracted between 2015 and 2016 and changes in market share
114
b)
change in contracted care
Extent of contracting
