
Page 116 - Effective healthcare cost containment policies Using the Netherlands as a case study - Niek W. Stadhouders
P. 116
Chapter 5
effect of a high percentage of home care patients, both and are correlated to
(6) (7)
Year effects are captured by year dummies. The error term is corrected for panel clusters. Equation (6) is estimated for elderly care and disability care separately.
volatility:
Elderly care Disability care Hospital care 0.0468*** (0.0067) 0.0478*** (0.0070) 0.0274 (0.0075) -0.0028 (0.0076) -0.011*** (0.0027) 0.0204*** (0.0029) -0.0113** (0.0076) -0.0048 (0.0052) -0.007 (0.0130) 0.0022* (0.0012) -0.0007 (0.0013) -0.0056 (0.0030)
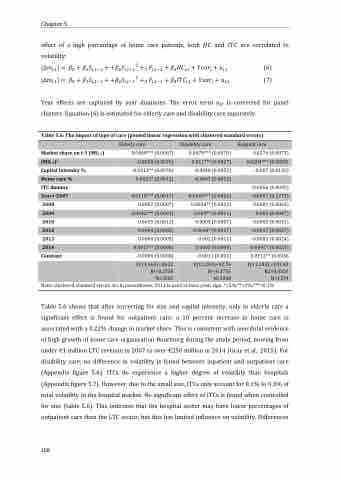
Table 5.6: The impact of type of care (pooled linear regression with clustered standard errors)
Market share on t-1 (MSt-1) Capital intensity %
ITC dummy
2008
2010
2013
Constant
0.0110*** (0.0017) 0.0169*** (0.0026) 0.0057 (0.1273) 0.0007 (0.0007) 0.0036** (0.0013) 0.0081 (0.0063) 0.0042*** (0.0001) 0.003** (0.0011) 0.002 (0.0047) 0.0015 (0.0012) 0.0005 (0.0007) 0.0055 (0.0031) 0.0004 (0.0005) 0.0044* (0.0017) -0.0017 (0.0027) 0.0008 (0.0005) 0.002 (0.0011) -0.0083 (0.0024) 0.0017** (0.0006) 0.0005 (0.0009) -0.0047* (0.0023) -0.0006 (0.0008) -0.0011 (0.001) 0.0112** (0.0036
(MSt-1)2
Home care %
Year= 2007
2009
2012
2014
F(11,563)=36.22 F(11,202)=92.76 F(11,283) =101.42 R2=0.2758 R2=0.3755 R2=0.3326 N=3505 N=1208 N=1374
Note: clustered standard errors are in parentheses; 2011 is used as base year; sign. *<5%;**<1%;***<0.1%
Table 5.6 shows that after correcting for size and capital intensity, only in elderly care a significant effect is found for outpatient care: a 10 percent increase in home care is associated with a 0.22% change in market share. This is consistent with anecdotal evidence of high growth of home care organisation Buurtzorg during the study period, moving from under €1 million LTC revenue in 2007 to over €250 million in 2014 (Gray et al., 2015). For disability care, no difference in volatility is found between inpatient and outpatient care (Appendix figure 5.6). ITCs do experience a higher degree of volatility than hospitals (Appendix figure 5.7). However, due to the small size, ITCs only account for 0.1% to 0.3% of total volatility in the hospital market. No significant effect of ITCs is found when controlled for size (table 5.6). This indicates that the hospital sector may have lower percentages of outpatient care than the LTC sector, but this has limited influence on volatility. Differences
108
