
Page 115 - Effective healthcare cost containment policies Using the Netherlands as a case study - Niek W. Stadhouders
P. 115
Do managed competition and active purchasing go hand in hand?
supports the finding that active purchasing is relatively low in the hospital sector. The results also indicate that higher capital intensity is associated with lower volatility: for an average provider, which experiences an average annual volatility of 0.0049% of the total market, volatility is reduced by 0.000545% (11.1%) for every 10% increase in capital intensity. Capital intensity is higher in LTC than in hospital care (11.0% resp. 8.6%), implying that budget reallocations may be easier in the hospital sector, i.e. volatility is expected to be higher. This also supports our findings that active purchasing is relatively low in the hospital sector.
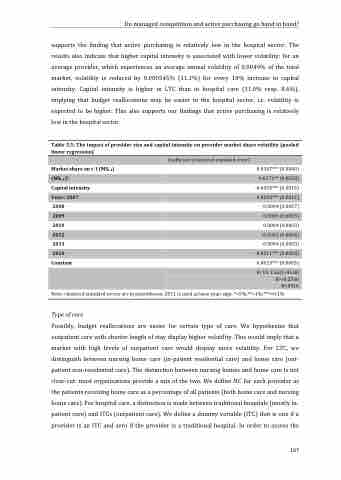
Table 5.5: The impact of provider size and capital intensity on provider market share volatility (pooled
Coefficient (clustered standard error)
linear regression)
Market share on t-1 (MSt-1) Capital intensity
2008
2010
2013
Constant
Possibly, budget reallocations are easier for certain type of care. We hypothesize that outpatient care with shorter length of stay display higher volatility. This would imply that a market with high levels of outpatient care would display more volatility. For LTC, we distinguish between nursing home care (in-patient residential care) and home care (out- patient non-residential care). The distinction between nursing homes and home care is not clear-cut: most organisations provide a mix of the two. We define for each provider as the patients receiving home care as a percentage of all patients (both home care and nursing home care). For hospital care, a distinction is made between traditional hospitals (mostly in- patient care) and ITCs (outpatient care). We define a dummy variable (ITC) that is one if a provider is an ITC and zero if the provider is a traditional hospital. In order to assess the
0.0347*** (0.0040) 0.0171** (0.0078) -0.0054*** (0.0016) 0.0053*** (0.0012) 0.0004 (0.0007) 0.0006 (0.0005) 0.0004 (0.0003) -0.0002 (0.0004) -0.0004 (0.0003) -0.0011*** (0.0003) 0.0013*** (0.0003)
(MSt-1)2
Year= 2007
2009
2012
2014
F( 10, 1562)=45.88 R2=0.2760 N=8316
Note: clustered standard errors are in parentheses; 2011 is used as base year; sign. *<5%;**<1%;***<0.1%
Type of care
107
