
Page 155 - Assessing right ventricular function and the pulmonary circulation in pulmonary hypertension Onno Anthonius Spruijt
P. 155
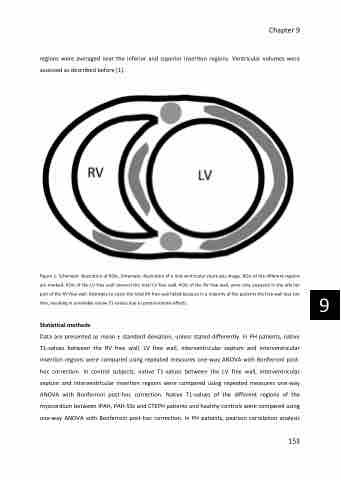
regions were averaged over the inferior and superior insertion regions. Ventricular volumes were assessed as described before [1].
Figure 1: Schematic illustration of ROIs. Schematic illustration of a mid-ventricular short-axis image. ROIs of the different regions are marked. ROIs of the LV free wall covered the total LV free wall. ROIs of the RV free wall, were only analyzed in the inferior part of the RV free wall. Attempts to cover the total RV free wall failed because in a majority of the patients the free wall was too thin, resulting in unreliable native T1-values due to partial volume effects.
Statistical methods
Data are presented as mean ± standard deviation, unless stated differently. In PH patients, native T1-values between the RV free wall, LV free wall, interventricular septum and interventricular insertion regions were compared using repeated measures one-way ANOVA with Bonferroni post- hoc correction. In control subjects, native T1-values between the LV free wall, interventricular septum and interventricular insertion regions were compared using repeated measures one-way ANOVA with Bonferroni post-hoc correction. Native T1-values of the different regions of the myocardium between IPAH, PAH-SSc and CTEPH patients and healthy controls were compared using one-way ANOVA with Bonferroni post-hoc correction. In PH patients, pearson correlation analysis
Chapter 9
  153
9
