
Page 90 - scheppingen
P. 90
four
88
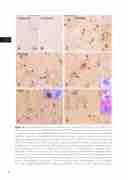
Figure 2 β1i proteasome subunit immunoreactivity in control, FCD type IIa, FCD type IIb and TSC. Panels A and B: control cortex (A) and with matter (B) with weak β1i expression (insert in A: negative neuron, high magnification). Panel C (FCD IIa) shows strong expression within the dysplastic region with positive dysmorphic neurons (arrows; inserts: a, nuclear expression; b, cy- toplasmic expression) and glial cells (insert in c). Panels D-E (FCD IIb) show several β1i positive cells within cortex (D) and white matter (E), including dysmorphic neurons (arrow in D), glial cells (arrow-heads D and E) and balloon cells (arrows in E; nuclear and cytoplasmic expression; insert: co-localization with the pS6). Panels F-G (TSC-tuber): β1i subunit expression is observed within the tuber in dysmorphic neurons (F: arrows, nuclear expression; arrow-head cytoplasmic expres- sion; insert a in F: co-localization with the neuronal marker NeuN; insert b in F: co-localization with the pS6), glial cells (insert b in G) and in giant cells (arrows in G; insert b: co-localization with GFAP; insert c: co-localization with HLA-I). The inserts within panels show imagines of the different cells types at higher magnification in separate specimens. Scale bar in G: A-C: 80 μm; D-G: 40 μm.
