
Page 153 - scheppingen
P. 153
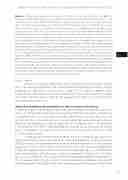
MIR147B: A NOVEL KEY REGULATOR OF IL-1β-MEDIATED INFLAMMATION IN ASTROCYTES
Figure 1. Differentially expressed small RNAs and mRNAs as identified from RNA-Seq. A Volca- no plot of differentially expressed small RNAs as identified from small RNA-Seq. Across both the controls and IL-1β stimulated fetal human astrocyte cultures there were 881 expressed small RNAs. Of these only miR146a-5p and miR147b were differentially expressed. miR147b was up-reg- ulated 3.78-fold in the IL-1β stimulated cultures (adjusted p-value<0.033), while miR146a-5p was up-regulated 5.35-fold in the IL-1β stimulated cultures (adjusted p-value<0.0008). B Volcano plot of differentially expressed mRNAs as identified from mRNA-Seq. Volcano plot showing the dif- ferential expressed genes between the control cultures and IL-1β stimulated cultures. 71 genes were up-regulated in the IL-1β stimulated cultures (adjusted p-value<0.05, fold-change>2), and 8 genes were down-regulated (adjusted p-value<0.05, fold-change<-2). C Enriched gene ontology terms derived from the differentially expressed gene lists. 16 GO terms were identified as enriched (Benjamini-Hochberg corrected p-value<0.05). Each enriched GO term is listed on the y-axis, the x-axis is the log10(1/adjusted p-value), n is equal to the number of the DEGs in each gene ontol- ogy terms. D Enrichment map of enriched pathways derived from the differentially expressed gene lists. 12 pathways were considered enriched (Benjamini-Hochberg corrected p-value<0.05). Each node represents a pathway, the size of the node reflects the statistical significance of each pathway. The larger the node the smaller the adjusted p-value e.g. TNF signaling pathway was statistically more significant than the retinoic acid-inducible gene I (RIG-I)-like receptor signaling pathway. The edge connection between nodes represents the similarity between the genes list of each pathway, the thicker the edge the more similar the gene lists.
(Fig 1D, Table 2).
Positive and negative correlations were calculated between miR147b and the
DEGs. The strongest correlation seen was between the expression of miR147b and the expression of C15orf48 (ρ = 0.96, p<0.0001, Supp. Fig 1). On closer inspection of the C15orf48 locus, it was found that the pre-miRNA of miR147b is transcribed from a region within the 3’ UTR of C15orf48. C15orf48 was up-regulated 30-fold in IL-1β stimulated cul- tures (adjusted p-value<0.02).
miR147b and inflammatory mediators in fetal astrocyte cell cultures
In order to validate miRNA sequencing results, fetal astrocyte cultures were stimulated with IL-1β, and miR147b expression was evaluated at different time points. miR147b was up-regulated after IL-1β stimulation with peak expression at 30 hours (p<0.0001, Fig 2A), but not after stimulation with LPS. miR147b could not be detected extracellularly. Previously, we showed that miR146a expression was increased after IL-1β stimulation 17. Pre-treatment with TPCA-1 dose-dependently reversed the up-regulation of miR146a (p<0.0001 for both 1 and 5 μM TPCA-1) and miR147b (p=0.0315 for 5 μM TPCA-1) after IL-1β stimulation (Fig 2B).
In order to examine the functional role of miR147b in astrocytes, cells were trans- fected with miR147b mimic, which led to an increase of expression as determined with qPCR (p<0.0001). miR147b overexpression led to reduced interleukin 6 (IL-6) and cyclo- oxygenase-2 (COX-2) mRNA expression levels after IL-1β stimulation by approximately 71 and 79%, respectively (p=0.0002 and p<0.0001 respectively, Fig 2C). IL-6 mRNA levels were also reduced by miR147b mimic under basal conditions, without IL-1β stimulation (p=0.0002). Transfection with miR147b mimic also reduced complement component 3 (C3) by approximately 35% (p<0.0001). Enzyme-Linked Immuno Sorbent Assay (ELISA) showed reduced IL-6 on protein level after transfection with miR147b mimic, both under
 151
six
