
Page 141 - scheppingen
P. 141
EXPRESSION OF MICRORNAS MIR21, MIR146A, AND MIR155 IN TSC
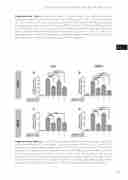
Supplementary Figure 2 Expression levels of miRNA targets after miRNA modulation. Quantitative real-time PCR of PDCD4 (A and E), TRAF6 (B and F), IRAK1 (C and G) and IRAK2 (D and H) expression in human fetal astrocytes (A-D) and SEGA-derived cell cultures (E-H) after transfection with either mimic or inhibitor of miRNA21 (A and E, PDCD4) and miRNA 146a (B-D; F-H, TRAF6, IRAK1-2). Data are expressed relative to the levels observed in untreated cells and are mean ± SEM from five separate experiments performed in duplicate. *p < 0.05, **p < 0.01, ***p < 0.001 compared to control; #p < 0.05, ##p < 0.01, ###p<0.001 between experimental samples, Mann-Whitney U test. SEGA: subependymal giant cell astrocytomas.
Supplementary Figure 3 IL-6 and COX2 expression levels after co-transfection with miRNA146a and anti-miRNA155 and IL-1β stimulation. Quantitative real-time PCR of IL-6 (A, C) and COX2 (B, D) expression in human fetal astrocytes (A, B) and SEGA-derived cell cultures (C, D) after either separate or simultaneous transfection with mimic of miRNA146a and anti-miRNA155 LNA. Data are expressed relative to the levels observed in untreated cells and are mean ± SEM of qPCR performed in triplicate from one representative fetal and one representative SEGA culture exper- iment performed in triplicate. ***p < 0.001 compared to control; #p < 0.05, ### p <0.001 between experimental samples, Mann-Whitney U test. SEGA: subependymal giant cell astrocytomas.
139
five
