
Page 139 - scheppingen
P. 139
Supplementary data
EXPRESSION OF MICRORNAS MIR21, MIR146A, AND MIR155 IN TSC
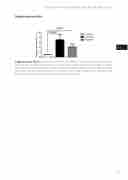
Supplementary Figure 1 Expression levels of IL-1β mRNA in cortical tubers. Quantitative real- time PCR of IL-1β mRNA expression in TSC and control samples, expressed as IL-1β/EF-1a relative amount; white column represent control samples, black column represent tuber samples (n= 15), grey column represent perituberal tissue samples (n=4), *p<0.05, compared to control (n=10). Kruskal-Wallis test followed by Dunn’s multiple comparison test.
137
five
