
Page 129 - Demo
P. 129
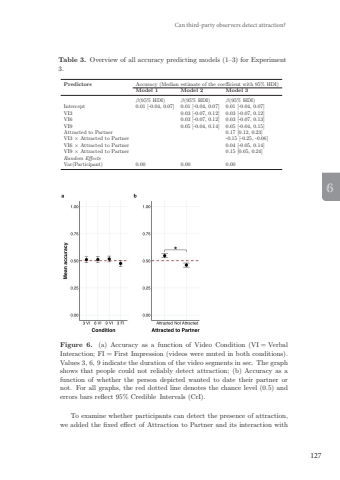
127Can third-party observers detect attraction?63 indicating a neutral level of certainty. Participants were prompted to takea break after 16 trials. The task consisted of 32 trials in total.Following the AJT, participants performed the ERT (for a description ofthe stimuli, see Supplemental Material). Each trial started with a centrallypresented fixation cross for 1000 ms, followed by the video stimulus. Then,six buttons displaying all possible emotional expressions (i.e., happy, sad,surprised, fearful, angry, neutral) were displayed and remained visible untila response was provided. Participants first practiced the task (5 trials) andthen completed the task (60 trials in total). Participants were not providedfeedback for their responses and were prompted to take a break after 30trials.After completion of the ERT, participants filled in the AQ and BDI,II and indicated if they were in a relationship, and if so its duration andqualitative status (e.g., married, dating, cohabitating). The study lastedapproximately 25 min. After finishing the study, participants were debriefedand thanked for their participation.Statistical AnalysesRegarding the AJT, we excluded trials with RTs�<�200 ms (0.04% acrossall conditions). Trials on which there were technical issues, for instance re,garding the presentation of the videos, were also excluded (0.16%). Afterapplying our exclusion criteria, we were left with 99.80% of the data. Re,garding the ERT, practice trials and trials with RTs faster than 200 ms wereexcluded (0.01%).To model accuracy, we followed the procedure as detailed in Statisti,cal Analyses [see General Methods section]. We coded the predictor VideoCondition using a sum-contrasting scheme. All models included a randomintercept per Participant. Our analyses were pre-registered on the AsPre,dicted database (Reference number: #37,849).ResultsFirst, we found no substantial evidence that participants could reliablydetect attraction (β�=�0.01, 95% HDI [-0.04, 0.07], p+�=�69.39%). Afteradding the fixed effect of Video Condition, there was no substantial dif,ference in accuracy between conditions (see Figure 6a; Table 3 Model 2);therefore, longer video segments did not influence participants’ ability todetect attraction in others.3 indicating a neutral level of certainty. Participants were prompted to takea break after 16 trials. The task consisted of 32 trials in total.Following the AJT, participants performed the ERT (for a description ofthe stimuli, see Supplemental Material). Each trial started with a centrallypresented fixation cross for 1000 ms, followed by the video stimulus. Then,six buttons displaying all possible emotional expressions (i.e., happy, sad,surprised, fearful, angry, neutral) were displayed and remained visible untila response was provided. Participants first practiced the task (5 trials) andthen completed the task (60 trials in total). Participants were not providedfeedback for their responses and were prompted to take a break after 30trials.After completion of the ERT, participants filled in the AQ and BDI,II and indicated if they were in a relationship, and if so its duration andqualitative status (e.g., married, dating, cohabitating). The study lastedapproximately 25 min. After finishing the study, participants were debriefedand thanked for their participation.Statistical AnalysesRegarding the AJT, we excluded trials with RTs�<�200 ms (0.04% acrossall conditions). Trials on which there were technical issues, for instance re,garding the presentation of the videos, were also excluded (0.16%). Afterapplying our exclusion criteria, we were left with 99.80% of the data. Re,garding the ERT, practice trials and trials with RTs faster than 200 ms wereexcluded (0.01%).To model accuracy, we followed the procedure as detailed in Statisti,cal Analyses [see General Methods section]. We coded the predictor VideoCondition using a sum-contrasting scheme. All models included a randomintercept per Participant. Our analyses were pre-registered on the AsPre,dicted database (Reference number: #37,849).ResultsFirst, we found no substantial evidence that participants could reliablydetect attraction (β�=�0.01, 95% HDI [-0.04, 0.07], p+�=�69.39%). Afteradding the fixed effect of Video Condition, there was no substantial dif,ference in accuracy between conditions (see Figure 6a; Table 3 Model 2);therefore, longer video segments did not influence participants’ ability todetect attraction in others.Table 3. Overview of all accuracy predicting models (1–3) for Experiment3.Predictors Accuracy (Median estimate of the coefficient with 95% HDI)Model 1 Model 2 Model 3β(95% HDI) β(95% HDI) β(95% HDI)Intercept 0.01 [-0.04, 0.07] 0.01 [-0.04, 0.07] 0.01 [-0.04, 0.07]VI3 0.03 [-0.07, 0.12] 0.03 [-0.07, 0.12]VI6 0.03 [-0.07, 0.12] 0.03 [-0.07, 0.13]VI9 0.05 [-0.04, 0.14] 0.05 [-0.04, 0.15]Attracted to Partner 0.17 [0.12, 0.23]VI3 × Attracted to Partner -0.15 [-0.25, -0.06]VI6 × Attracted to Partner 0.04 [-0.05, 0.14]VI9 × Attracted to Partner 0.15 [0.05, 0.24]Random EffectsVar(Participant) 0.00 0.00 0.00Figure 6. (a) Accuracy as a function of Video Condition (VI = VerbalInteraction; FI = First Impression (videos were muted in both conditions). Values3, 6, 9 indicate the durations of the video segments in sec. The graph showsthat people could not reliably detect attraction; (b) Accuracy as a function ofwhether the person depicted wanted to date their partner or not. For all graphs,the red dotted line denotes the chance level (0.5) and errors bars reflect 95%Credible Intervals (CrI).To examine whether participants can detect the presence of attraction,we added the fixed e ffect of At traction to Pa rtner an d it s interaction withTable 3. Overview of all accuracy predicting models (1–3) for Experiment3.Predictors Accuracy (Median estimate of the coefficient with 95% HDI)Model 1 Model 2 Model 3β(95% HDI) β(95% HDI) β(95% HDI)Intercept 0.01 [-0.04, 0.07] 0.01 [-0.04, 0.07] 0.01 [-0.04, 0.07]VI3 0.03 [-0.07, 0.12] 0.03 [-0.07, 0.12]VI6 0.03 [-0.07, 0.12] 0.03 [-0.07, 0.13]VI9 0.05 [-0.04, 0.14] 0.05 [-0.04, 0.15]Attracted to Partner 0.17 [0.12, 0.23]VI3 × Attracted to Partner -0.15 [-0.25, -0.06]VI6 × Attracted to Partner 0.04 [-0.05, 0.14]VI9 × Attracted to Partner 0.15 [0.05, 0.24]Random EffectsVar(Participant) 0.00 0.00 0.00Figure 6. (a) Accuracy as a function of Video Condition (VI = VerbalInteraction; FI = First Impression (videos were muted in both conditions). Values3, 6, 9 indicate the durations of the video segments in sec. The graph showsthat people could not reliably detect attraction; (b) Accuracy as a function ofwhether the person depicted wanted to date their partner or not. For all graphs,the red dotted line denotes the chance level (0.5) and errors bars reflect 95%Credible Intervals (CrI).To examine whether participants can detect the presence of attraction,we added the fixed e ffect of At traction to Pa rtner an d it s interaction withTable 3. Overview of all accuracy predicting models (1–3) for Experiment3.Predictors Accuracy (Median estimate of the coefficient with 95% HDI)Model 1 Model 2 Model 3β(95% HDI) β(95% HDI) β(95% HDI)Intercept 0.01 [-0.04, 0.07] 0.01 [-0.04, 0.07] 0.01 [-0.04, 0.07]VI3 0.03 [-0.07, 0.12] 0.03 [-0.07, 0.12]VI6 0.03 [-0.07, 0.12] 0.03 [-0.07, 0.13]VI9 0.05 [-0.04, 0.14] 0.05 [-0.04, 0.15]Attracted to Partner 0.17 [0.12, 0.23]VI3 × Attracted to Partner -0.15 [-0.25, -0.06]VI6 × Attracted to Partner 0.04 [-0.05, 0.14]VI9 × Attracted to Partner 0.15 [0.05, 0.24]Random EffectsVar(Participant) 0.00 0.00 0.00Figure 6. (a) Accuracy as a function of Video Condition (VI = VerbalInteraction; FI = First Impression (videos were muted in both conditions). Values3, 6, 9 indicate the durations of the video segments in sec. The graph showsthat people could not reliably detect attraction; (b) Accuracy as a function ofwhether the person depicted wanted to date their partner or not. For all graphs,the red dotted line denotes the chance level (0.5) and errors bars reflect 95%Credible Intervals (CrI).To examine whether participants can detect the presence of attraction,we added the fixed e ffect of At traction to Pa rtner an d it s interaction withTable 3. Overview of all accuracy predicting models (1–3) for Experiment3.Predictors Accuracy (Median estimate of the coefficient with 95% HDI)Model 1 Model 2 Model 3β(95% HDI) β(95% HDI) β(95% HDI)Intercept 0.01 [-0.04, 0.07] 0.01 [-0.04, 0.07] 0.01 [-0.04, 0.07]VI3 0.03 [-0.07, 0.12] 0.03 [-0.07, 0.12]VI6 0.03 [-0.07, 0.12] 0.03 [-0.07, 0.13]VI9 0.05 [-0.04, 0.14] 0.05 [-0.04, 0.15]Attracted to Partner 0.17 [0.12, 0.23]VI3 ⇥ Attracted to Partner -0.15 [-0.25, -0.06]VI6 ⇥ Attracted to Partner 0.04 [-0.05, 0.14]VI9 ⇥ Attracted to Partner 0.15 [0.05, 0.24]Random EffectsVar(Participant) 0.00 0.00 0.00Figure 6. (a) Accuracy as a function of Video Condition (VI�=�VerbalInteraction; FI�=�First Impression (videos were muted in both conditions).Values 3, 6, 9 indicate the duration of the video segments in sec. The graphshows that people could not reliably detect attraction; (b) Accuracy as afunction of whether the person depicted wanted to date their partner ornot. For all graphs, the red dotted line denotes the chance level (0.5) anderrors bars reflect 95% Credible Intervals (CrI).To examine whether participants can detect the presence of attraction,we added the fixed effect of Attraction to Partner and its interaction withTable 3. Overview of all accuracy predicting models (1–3) for Experiment3.Predictors Accuracy (Median estimate of the coefficient with 95% HDI)Model 1 Model 2 Model 3β(95% HDI) β(95% HDI) β(95% HDI)Intercept 0.01 [-0.04, 0.07] 0.01 [-0.04, 0.07] 0.01 [-0.04, 0.07]VI3 0.03 [-0.07, 0.12] 0.03 [-0.07, 0.12]VI6 0.03 [-0.07, 0.12] 0.03 [-0.07, 0.13]VI9 0.05 [-0.04, 0.14] 0.05 [-0.04, 0.15]Attracted to Partner 0.17 [0.12, 0.23]VI3 ⇥ Attracted to Partner -0.15 [-0.25, -0.06]VI6 ⇥ Attracted to Partner 0.04 [-0.05, 0.14]VI9 ⇥ Attracted to Partner 0.15 [0.05, 0.24]Random EffectsVar(Participant) 0.00 0.00 0.00Figure 6. (a) Accuracy as a function of Video Condition (VI�=�VerbalInteraction; FI�=�First Impression (videos were muted in both conditions).Values 3, 6, 9 indicate the duration of the video segments in sec. The graphshows that people could not reliably detect attraction; (b) Accuracy as afunction of whether the person depicted wanted to date their partner ornot. For all graphs, the red dotted line denotes the chance level (0.5) anderrors bars reflect 95% Credible Intervals (CrI).To examine whether participants can detect the presence of attraction,we added the fixed effect of Attraction to Partner and its interaction withIliana Samara 17x24.indd 127 08-04-2024 16:36
