
Page 122 - Demo
P. 122
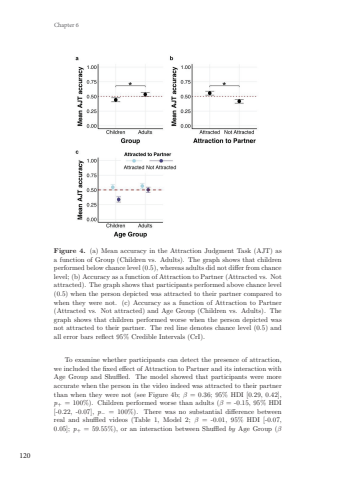
120Chapter 6Figure 4. (a) Mean accuracy in the Attraction Judgment Task (AJT) asa function of Group (Children vs. Adults). The graph shows that childrenperformed below chance level (0.5), whereas adults did not differ from chancelevel; (b) Accuracy as a function of Attraction to Partner (Attracted vs. Notattracted). The graph shows that participants performed above chance level(0.5) when the person depicted was attracted to their partner compared towhen they were not. (c) Accuracy as a function of Attraction to Partner(Attracted vs. Not attracted) and Age Group (Children vs. Adults). Thegraph shows that children performed worse when the person depicted wasnot attracted to their partner. The red line denotes chance level (0.5) andall error bars reflect 95% Credible Intervals (CrI).To examine whether participants can detect the presence of attraction,we included the fixed effect of Attraction to Partner and its interaction withAge Group and Shuffled. The model showed that participants were moreaccurate when the person in the video indeed was attracted to their partnerthan when they were not (see Figure 4b; β = 0.36; 95% HDI [0.29, 0.42],p+ = 100%). Children performed worse than adults (β = -0.15, 95% HDI[-0.22, -0.07], p− = 100%). There was no substantial difference betweenreal and shuffled videos (Table 1, Model 2; β = -0.01, 95% HDI [-0.07,0.05]; p+ = 59.55%), or an interaction between Shuffled by Age Group (βIliana Samara 17x24.indd 120 08-04-2024 16:36
