
Page 57 - Imaging of Osteoarthritis and Rheumatoid Arthritis in Hand Joints
P. 57
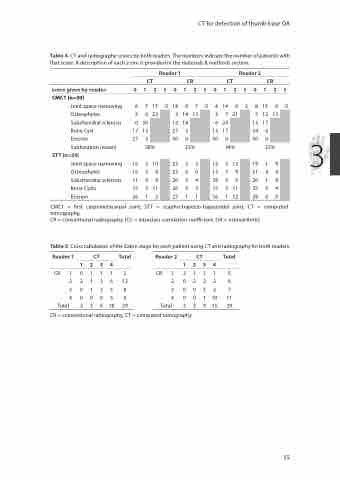
 Table 4. CT and radiography scores by both readers. The numbers indicate the number of patients with that score. A description of each score is provided in the materials & methods section.
Reader 1 Reader 2
CT CR CT CR
score given by reader: 0 1 2 3 0 1 2 3 0 1 2 3 0 1 2 3
CMC1 (n=30)
Joint space narrowing 6 Osteophytes 2
Subchondral sclerosis Bone Cyst
Erosion
Subluxation (mean)
STT (n=29)
Joint space narrowing Osteophytes Subchondral sclerosis Bone Cysts
Erosion
23%
3 3 6 0 5 4 0 3 1 1
34% 22%
7 17
6 22 0 30
17 13 27 3
38%
0
14 9 3 14 12 18 27 3 30 0
7 13
04 14 2 7 6 24 13 17 30 0
9 21
38 13 9 5 12 13
13 17 24 6 30 0
0
3
16 3 16 5 11 9 15 3 26 1
10 8 9 11 2
23 23 20 26 27
12 5 13 7 29 0 15 3 16 1
12 9 0 11 12
19 1 9 21 4 4 20 1 8 25 0 4 29 0 0
CMC1 = first carpometacarpal joint, STT = scapho-trapezio-trapezoidal joint, CT = computed tomography,
CR = conventional radiography, ICC = intraclass correlation coefficient, OA = osteoarthritis
Table 5. Cross tabulation of the Eaton stage for each patient using CT and radiography for both readers.
Reader 1 CT Total Reader 2 CT Total 1234 1234
CR 1 0 1 1 1 3 CR 1 2 1 1 1 5 2 2 1 3 6 12 2 0 2 2 2 6 301258 300527 4 0 0 0 6 6 4 0 0 1 10 11
Total 2 3 6 18 29 Total 2 3 9 15 29 CR = conventional radiography, CT = computed tomography
CT for detection of thumb base OA
55
