Page 139 - Breeding and regulatory opportunities, Renaud
P. 139
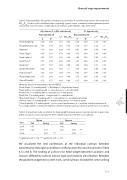
Broccoli crop improvement


Table 4.5 Repeatabilities (H), genetic correlations (r) and ratio of correlated response to direct response
A
(CRorg/Rorg) for broccoli horticulture traits comparing organic versus conventional management systems
over all trial season/location combinations (all cultivars and Fhybrids only), 2006-2008.
1

All cultivars (Fs, OPs and inbreds)
F1 hybrids only
1
Repeatability (H)
Repeatability (H)
r¶¶ CR/R
r¶¶ CR/R
C O A orgorg C O A orgorg

Head Weight (g) 0.78 0.85 0.91 0.87 0.60 0.68 0.73 0.69

Head Diameter (cm) 0.61 0.75 0.81 0.73 0.14 0.00 0.22 >1

Maturity†
0.79 0.80 0.98 0.97 0.81 0.86 0.98 0.95

Head Shape0.47 0.37 0.73 0.83 0.72 0.69 0.87 0.89
‡

Head Surface§
0.81 0.77 0.90 0.92 0.46 0.53 0.85 0.79

Head Color¶
0.51 0.48 0.83 0.85 0.29 0.46 0.74 0.59

Bead Size#
0.77 0.67 0.82 0.88 0.69 0.64 0.71 0.73

Bead Uniformity†† 0.24 0.03 0.66 >1 0.09 0.23 0.65 0.42

Hollow Stem‡‡
0.40 0.57 0.84 0.70 0.49 0.67 0.88 0.75

Plant Height (cm) 0.77 0.69 0.93 0.98 0.72 0.65 0.95 0.99

Overall Quality0.72 0.77
0.89 0.86 0.17 0.48
0.63 0.38
§§

†Maturity: days from transplant to harvest (DTH).
‡Head Shape: (1-9 ranking with 1 = lat shape; 9 = high dome shape).

§Head Surface: (1-9 ranking with 1 = very uneven; 9 = smooth head).
¶Head Color: (1-9 ranking with 1 = pale green; 9 = dark green).

#Bead Size: (1-9 ranking with 1 = large beads; 9 = small beads).
††Bead Uniformity: (1-9 ranking with 1 = not uniform; 9 = excellent uniformity).

‡‡Hollow Stem: (1-9 ranking with 1 = many hollow stem; 9 = no hollow stem).
§§Overall quality: (1-9 ranking with 1 = poor overall performance; 9 = excellent overall performance).

¶¶r : average genetic correlation between conventional and organic production systems across locations. A


Table 4.6 Spearman’s rank correlation for head weight between paired conventional and organic sites

within a location, season and year for the F1 hybrid subset (n=18) of broccoli cultivars.


Maine
Oregon
Year
Spring
Fall
Spring
Fall

2006
0.51 0.42

2007
0.69 *** 0.24
0.15 0.33

2008
0.54 *
0.69
***

* Signiicant at P < 0.05; *** signiicant at P < 0.001.


We visualized the rank correlations of the individual cultivars between


conventional and organic conditions at the location by season trial level in Table

4.7a and b. The ranking of cultivars for head weight between Locations and

Seasons difered by cultivar, cultivar type and maturity classiication. Between

the paired management system trials, some cultivars showed the same ranking


121