
Page 40 - THE DUTCH TALKING TOUCH SCREEN QUESTIONNAIRE
P. 40
Chapter 2
RESULTS
PSC ease of use
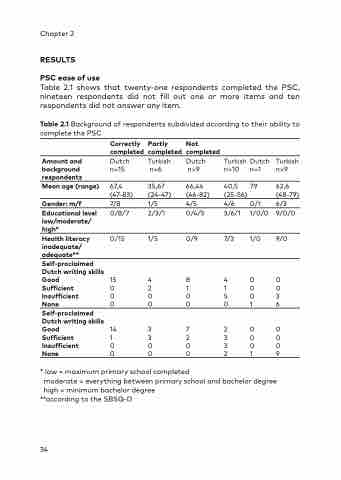
Table 2.1 shows that twenty-one respondents completed the PSC, nineteen respondents did not fill out one or more items and ten respondents did not answer any item.
Table 2.1 Background of respondents subdivided according to their ability to complete the PSC
Correctly Partly Not completed completed completed
Amount and background respondents Mean age (range)
Gender: m/f Educational level
low/moderate/ high*
Health literacy inadequate/ adequate** Self-proclaimed Dutch writing skills Good
Sufficient Insufficient
None Self-proclaimed Dutch writing skills Good
Sufficient Insufficient None
Dutch Turkish n=15 n=6
67,4 35,67 (47-83) (24-47) 7/8 1/5 0/8/7 2/3/1
0/15 1/5
15 4
0 2
0 0 0 5 0 3 000016
1437200 1 3 2 300 0 0 0 3 0 0 000219
Dutch Turkish Dutch Turkish n=9 n=10 n=1 n=9
66,44 40,5 79 62,6 (46-82) (25-56) (48-79) 4/5 4/6 0/1 6/3 0/4/5 3/6/1 1/0/0 9/0/0
0/9 7/3 1/0 9/0
8 400
1 100
* low = maximum primary school completed
moderate = everything between primary school and bachelor degree high = minimum bachelor degree
**according to the SBSQ-D
34
