
Page 102 - THE PERCEPT STUDY Illness Perceptions in Physiotherapy Edwin de Raaij
P. 102
Chapter 5
Baseline IPs
After being added to Block 2, most IP dimensions did not increase predictive values for poor outcomes on PI, PF or GPE. Two IP dimensions did add predictive value: lower scores on Treatment Control for PI and GPE; and a higher score on Timeline for PF. The discrimination of each model after adding IPs increased slightly (the AUC increased by 2-3%). The goodness- of-fit was adequate (Hosmer & Lemeshow test (PI: p = 0.57; PSFS: p = 0.68; GPE: p = .08)) (Table 5).
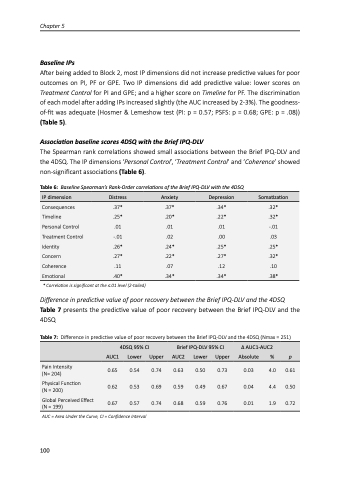
Association baseline scores 4DSQ with the Brief IPQ-DLV
The Spearman rank correlations showed small associations between the Brief IPQ-DLV and the 4DSQ. The IP dimensions ‘Personal Control’, ‘Treatment Control’ and ‘Coherence’ showed non-significant associations (Table 6).
Table 6: Baseline Spearman’s Rank-Order correlations of the Brief IPQ-DLV with the 4DSQ
IP dimension
Distress
Anxiety
Depression
Somatization
Consequences
.37*
.37*
.34*
.32*
Timeline
.25*
.20*
.22*
.32*
Personal Control
.01
.01
.01
-.01
Treatment Control
-.01
.02
.00
.03
Identity
.26*
.24*
.25*
.25*
Concern
.27*
.22*
.27*
.32*
Coherence
.11
.07
.12
.10
Emotional
.40*
.34*
.34*
.38*
* Correlation is significant at the ≤.01 level (2-tailed)
Difference in predictive value of poor recovery between the Brief IPQ-DLV and the 4DSQ
Table 7 presents the predictive value of poor recovery between the Brief IPQ-DLV and the 4DSQ
Table 7: Difference in predictive value of poor recovery between the Brief IPQ-DLV and the 4DSQ (Nmax = 251)
4DSQ 95% CI
Brief IPQ-DLV 95% CI
∆ AUC1-AUC2
AUC1
Lower
Upper
AUC2
Lower
Upper
Absolute
%
p
Pain Intensity (N= 204)
0.65
0.54
0.74
0.63
0.50
0.73
0.03
4.0
0.61
Physical Function (N = 200)
0.62
0.53
0.69
0.59
0.49
0.67
0.04
4.4
0.50
Global Perceived Effect (N = 199)
0.67
0.57
0.74
0.68
0.59
0.76
0.01
1.9
0.72
AUC = Area Under the Curve, CI = Confidence Interval
100
