
Page 101 - THE PERCEPT STUDY Illness Perceptions in Physiotherapy Edwin de Raaij
P. 101
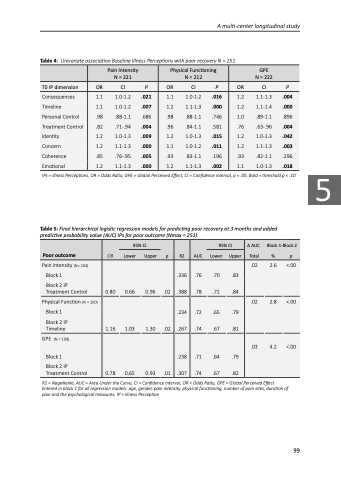
IPs = Illness Perceptions, OR = Odds Ratio, GPE = Global Perceived Effect, CI = Confidence interval, p = .05, Bold = threshold p < .10
Table 5: Final hierarchical logistic regression models for predicting poor recovery at 3 months and added predictive probability value (AUC) IPs for poor outcome (Nmax = 251)
A multi-center longitudinal study
 Table 4: Univariate association Baseline Illness Perceptions with poor recovery N = 251
   Pain Intensity N = 221
  Physical Functioning N = 212
  GPE N = 222
 T0 IP dimension
  OR
 CI
 P
  OR
 CI
 P
  OR
 CI
 P
 Consequences
  1.1
 1.0-1.2
 .021
  1.1
 1.0-1.2
 .016
  1.2
 1.1-1.3
 .004
Timeline
 1.1
1.0-1.2
.007
 1.2
1.1-1.3
.000
 1.2
1.1-1.4
.000
Personal Control
 .98
.88-1.1
.686
 .98
.88-1.1
.746
 1.0
.89-1.1
.896
Treatment Control
 .82
.71-.94
.004
 .96
.84-1.1
.581
 .76
.63-.96
.004
Identity
 1.2
1.0-1.3
.009
 1.2
1.0-1.3
.015
 1.2
1.0-1.3
.042
Concern
 1.2
1.1-1.3
.000
 1.1
1.0-1.2
.011
 1.2
1.1-1.3
.003
Coherence
 .85
.76-.95
.005
 .93
.83-1.1
.196
 .93
.82-1.1
.296
Emotional
  1.2
 1.1-1.3
 .000
  1.2
 1.1-1.3
 .002
  1.1
 1.0-1.3
 .018
       95% CI
      95% CI
  ∆ AUC
 Block 1-Block 2
Poor outcome
 OR
 Lower
 Upper
 p
 R2
AUC
 Lower
  Upper
Total
%
p
 Pain Intensity (N= 204)
             .02
 2.6
 <.00
Block 1
   .336
.76
.70
 .83
Block 2 IP Treatment Control
 0.80
0.66
0.96
 .02
 .388
.78
.72
 .84
  Physical Function (N = 200)
                                  .02
    2.8
     <.00
Block 1
   .234
.72
.65
 .79
Block 2 IP Timeline
   1.16
      1.03
 1.30
     .02
       .267
   .74
  .67
  .81
                GPE (N = 199)
    .03
4.2
<.00
Block 1
   .238
.71
.64
 .79
Block 2 IP Treatment Control
  0.78
 0.65
 0.93
  .01
  .307
 .74
 .67
  .82
      R2 = Nagelkerke, AUC = Area Under the Curve, CI = Confidence Interval, OR = Odds Ratio, GPE = Global Perceived Effect Entered in block 1 for all regression models: age, gender, pain intensity, physical functioning, number of pain sites, duration of pain and the psychological measures, IP = Illness Perception
99
5
