
Page 32 - A bird’s-eye view of recreation - Rogier Pouwels
P. 32
A bird's-eye view of recreation
10,000 9,000 8,000 7,000 6,000 5,000 4,000 3,000 2,000 1,000
0
0 1,000 2,000
Distance from car park; as crow flies (m)
5,000
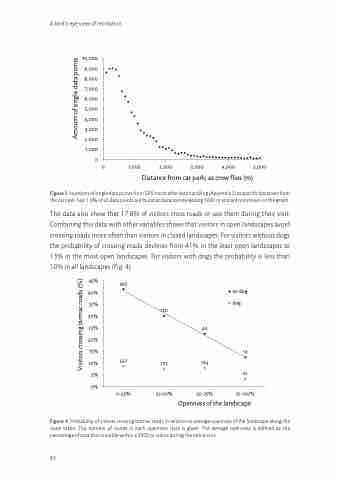
Figure 3. Numbers of single data points from GPS tracks after data handling (Appendix 2) at specific distances from the car park. Just 1.6% of all data points are found at distances exceeding 5000 m and are not shown on the graph.
The data also show that 17.6% of visitors cross roads or use them during their visit. Combining this data with other variables shows that visitors in open landscapes avoid crossing roads more often than visitors in closed landscapes. For visitors without dogs the probability of crossing roads declines from 41% in the least open landscapes to 13% in the most open landscapes. For visitors with dogs the probability is less than 10% in all landscapes (Fig. 4).
45% 40% 35% 30% 25% 20% 15% 10% 5% 0%
350
527
0-25%
no dog dog
16
61
25-50% 50-75%
Openness of the landscape
3,000 4,000
120
40
275 164
Figure 4. Probability of visitors crossing tarmac roads in relation to average openness of the landscape along the route taken. The number of routes in each openness class is given. The average openness is defined as the percentage of area that is visible within a 3000 m radius during the entire visit.
30
75-100%
Visitors crossing tarmac roads (%)
Amount of single data points
