
Page 30 - A bird’s-eye view of recreation - Rogier Pouwels
P. 30
A bird's-eye view of recreation
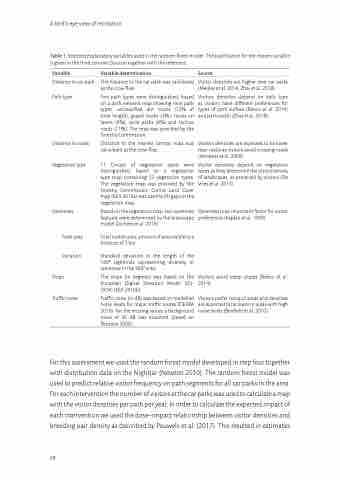
Table 1. Selected explanatory variables used in the random forest model. The justification for the chosen variable is given in the third column (Source) together with the reference.
Variable
Distance to car park Path type
Distance to roads Vegetation type
Openness:
Total area Variation
Slope Traffic noise
Variable determination
The distance to the car park was calculated as the crow flies.
Five path types were distinguished, based on a path network map showing nine path types: unclassified dirt tracks (72% of total length), gravel tracks (3%), tracks on lawns (6%), cycle paths (8%) and tarmac roads (11%). The map was provided by the Forestry Commission.
Distance to the nearest tarmac road was calculated as the crow flies.
11 Groups of vegetation types were distinguished, based on a vegetation type map containing 52 vegetation types. The vegetation map was provided by the Forestry Commission. Corine Land Cover map (EEA 2016a) was used to fill gaps in the vegetation map.
Based on the vegetation map, two openness features were determined by the Viewscape model (Jochem et al. 2016):
Total visible area; amount of area visible to a distance of 3 km.
Standard deviation in the length of the 180° sightlines representing diversity in openness in the 360° view.
The slope (in degrees) was based on the European Digital Elevation Model (EU- DEM) (EEA 2016b).
Traffic noise (in dB) was based on modelled noise levels for major traffic routes (DEFRA 2016). For the missing values a background noise of 35 dB was assumed (based on Pesonen 2000).
Source
Visitor densities are higher near car parks (Meijles et al. 2014, Zhai et al. 2018).
Visitors densities depend on path type as visitors have different preferences for types of path surface (Beeco et al. 2014) and path width (Zhai et al. 2018).
Visitors densities are expected to be lower near roads as visitors avoid crossing roads (Henkens et al. 2006).
Visitor densities depend on vegetation types as they determine the attractiveness of landscapes, as perceived by visitors (De Vries et al. 2013) .
Openness is an important factor for visitor preferences (Kaplan et al. 1989).
Visitors avoid steep slopes (Beeco et al. 2014).
Visitors prefer tranquil areas and densities are expected to be lower in areas with high noise levels (Benfield et al. 2010).
For this assessment we used the random forest model developed in step four together with distribution data on the Nightjar (Newton 2010). The random forest model was used to predict relative visitor frequency on path segments for all car parks in the area. For each intervention the number of visitors at the car parks was used to calculate a map with the visitor densities per path per year. In order to calculate the expected impact of each intervention we used the dose–impact relationship between visitor densities and breeding pair density as described by Pouwels et al. (2017). This resulted in estimates
28
