
Page 90 - Demo
P. 90
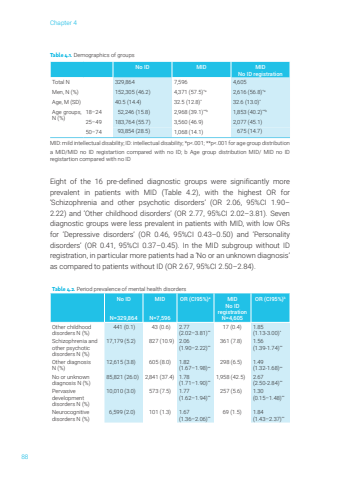
Chapter 488Table 4.1. Demographics of groupsNo ID MID MIDNo ID registrationTotal N 329,864 7,596 4,605 Men, N (%) 152,305 (46.2) 4,371 (57.5)*a 2,616 (56.8)*aAge, M (SD) 40.5 (14.4) 32.5 (12.8)* 32.6 (13.0)*Age groups, N (%)18–24 52,246 (15.8) 2,968 (39.1)**b 1,853 (40.2)**b25–49 183,764 (55.7) 3,560 (46.9) 2,077 (45.1)50–74 93,854 (28.5) 1,068 (14.1) 675 (14.7)MID: mild intellectual disability; ID: intellectual disability; *p<.001; **p<.001 for age group distribution a MID/MID no ID registartion compared with no ID; b Age group distribution MID/ MID no ID registartion compared with no IDEight of the 16 pre-defined diagnostic groups were significantly more prevalent in patients with MID (Table 4.2), with the highest OR for ‘Schizophrenia and other psychotic disorders’ (OR 2.06, 95%CI 1.90–2.22) and ‘Other childhood disorders’ (OR 2.77, 95%CI 2.02–3.81). Seven diagnostic groups were less prevalent in patients with MID, with low ORs for ‘Depressive disorders’ (OR 0.46, 95%CI 0.43–0.50) and ‘Personality disorders’ (OR 0.41, 95%CI 0.37–0.45). In the MID subgroup without ID registration, in particular more patients had a ‘No or an unknown diagnosis’ as compared to patients without ID (OR 2.67, 95%CI 2.50–2.84). Table 4.2. Period prevalence of mental health disordersNo ID N=329,864MIDN=7,596OR (CI95%)a MID No ID registrationN=4,605OR (CI95%)bOther childhood disorders N (%) 441 (0.1) 43 (0.6) 2.77 (2.02–3.81)** 17 (0.4) 1.85 (1.13-3.00)*Schizophrenia and other psychotic disorders N (%)17,179 (5.2) 827 (10.9) 2.06 (1.90–2.22)** 361 (7.8) 1.56 (1.39-1.74)**Other diagnosis N (%)12,615 (3.8) 605 (8.0) 1.82 (1.67–1.98)** 298 (6.5) 1.49 (1.32-1.68)**No or unknown diagnosis N (%)85,821 (26.0) 2,841 (37.4) 1.78 (1.71–1.90)**1,958 (42.5) 2.67 (2.50-2.84)**Pervasive development disorders N (%)10,010 (3.0) 573 (7.5) 1.77 (1.62–1.94)** 257 (5.6) 1.30 (0.15–1.48)**Neurocognitive disorders N (%) 6,599 (2.0) 101 (1.3) 1.67 (1.36–2.06)** 69 (1.5) 1.84 (1.43–2.37)**Katrien Pouls sHL.indd 88 24-06-2024 16:26
