
Page 92 - Human Bile Acid Metabolism: a Postprandial Perspective
P. 92
Chapter 5
A10 8 6 4 2
* **
B 800 600 400 200
** **
**
00 60 120 180 240 Time (min)
00 60 120 180 240 Time (min)
C10 D2.0 1.5
5
0
E 0.8 0.6 0.4 0.2 0.0
G40 30 20 10 0
0 60 120 180 240
1.0 0.5 0.0
F 25 20 15 10 5 0
0 60 120 180 240 Time (min)
** *
0 60 120 180 240
Time (min)
14 hr fast
40 hr fast
Time (min) *** ***
*
*
0 60 120 180 240
Time (min)
0 60 120 180
Time (min)
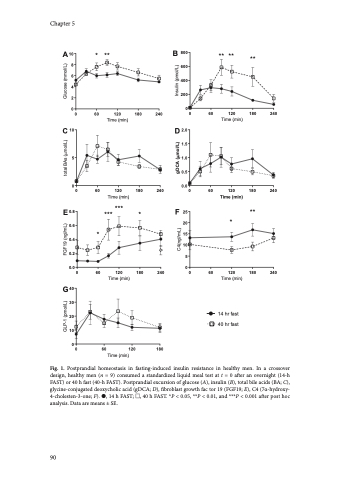
Fig. 1. Postprandial homeostasis in fasting-induced insulin resistance in healthy men. In a crossover design, healthy men (n = 9) consumed a standardized liquid meal test at t = 0 after an overnight (14-h FAST) or 40 h fast (40-h FAST). Postprandial excursion of glucose (A), insulin (B), total bile acids (BA; C), glycine-conjugated deoxycholic acid (gDCA; D), fibroblast growth fac tor 19 (FGF19; E), C4 (7α-hydroxy- 4-cholesten-3-one; F). ●, 14 h FAST; , 40 h FAST. *P < 0.05, **P < 0.01, and ***P < 0.001 after post hoc analysis. Data are means ± SE.
90
GLP-1 (pmol/L) FGF19 (ngl/mL) total BAs (Pmol/L) Glucose (mmol/L)
C4(ngl/mL)
gDCA (Pmol/L) Insulin (pmol/L)
