
Page 75 - Human Bile Acid Metabolism: a Postprandial Perspective
P. 75
All subjects completed the entire VLCD period in full compliance with the diet. Mean weight loss was 4.5 ± 2.3 kg (p < 0.0001). There were no significant effects of the diet on fasting plasma glucose (4.6 ± 0.6 vs. 4.7 ± 0.4 mmol/L; p = 0.78) or insulin (119 ± 36 vs. 122 ± 58 pmol/L; p = 0.94), which was reflected in unaltered HOMA-IR (3.5 ± 1.2 vs. 3.7 ± 1.7 mmol/L; p = 0.67).
Meal test
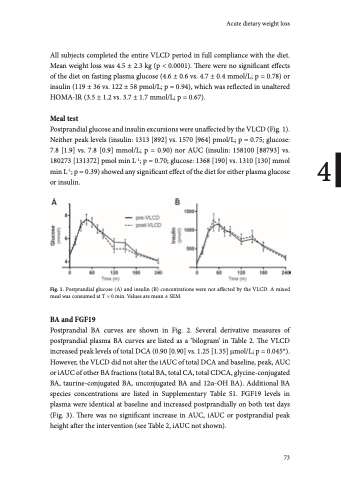
Postprandial glucose and insulin excursions were unaffected by the VLCD (Fig. 1).
Neither peak levels (insulin: 1313 [892] vs. 1570 [964] pmol/L; p = 0.75; glucose:
7.8 [1.9] vs. 7.8 [0.9] mmol/L; p = 0.90) nor AUC (insulin: 158100 [88793] vs. 4 180273 [131372] pmol min L-1; p = 0.70; glucose: 1368 [190] vs. 1310 [130] mmol
min L-1; p = 0.39) showed any significant effect of the diet for either plasma glucose
or insulin.
Fig. 1. Postprandial glucose (A) and insulin (B) concentrations were not affected by the VLCD. A mixed meal was consumed at T = 0 min. Values are mean ± SEM.
BA and FGF19
Postprandial BA curves are shown in Fig. 2. Several derivative measures of postprandial plasma BA curves are listed as a ‘bilogram’ in Table 2. The VLCD increased peak levels of total DCA (0.90 [0.90] vs. 1.25 [1.35] mmol/L; p = 0.045*). However, the VLCD did not alter the iAUC of total DCA and baseline, peak, AUC or iAUC of other BA fractions (total BA, total CA, total CDCA, glycine-conjugated BA, taurine-conjugated BA, unconjugated BA and 12α-OH BA). Additional BA species concentrations are listed in Supplementary Table S1. FGF19 levels in plasma were identical at baseline and increased postprandially on both test days (Fig. 3). There was no significant increase in AUC, iAUC or postprandial peak height after the intervention (see Table 2, iAUC not shown).
Acute dietary weight loss
73
