
Page 55 - Human Bile Acid Metabolism: a Postprandial Perspective
P. 55
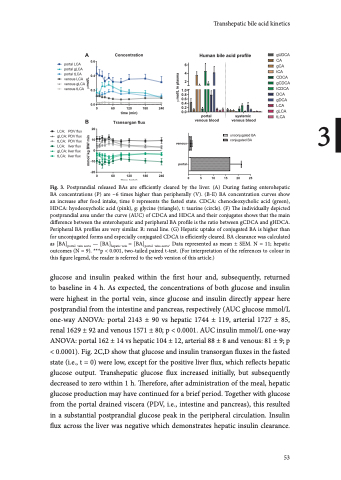
 Fig. 3. Postprandial released BAs are efficiently cleared by the liver. (A) During fasting enterohepatic BA concentrations (P) are ~6 times higher than peripherally (V). (B-E) BA concentration curves show an increase after food intake, time 0 represents the fasted state. CDCA: chenodeoxycholic acid (green), HDCA: hyodeoxycholic acid (pink), g: glycine (triangle), t: taurine (circle). (F) The individually depicted postprandial area under the curve (AUC) of CDCA and HDCA and their conjugates shows that the main difference between the enterohepatic and peripheral BA profile is the ratio between gCDCA and gHDCA. Peripheral BA profiles are very similar. R: renal line. (G) Hepatic uptake of conjugated BA is higher than for unconjugated forms and especially conjugated CDCA is efficiently cleared. BA clearance was calculated
gCDCA A PDV flux - major bile acids CDCA
B PDV flux - minor bile acids
= [BA]
outcomes (N = 9). ***p < 0.001, two-tailed paired t-test. (For interpretation of the references to colour in
as [BA] gHDCA —600 [BA] portal vein aorta
. DatatCDrCeApres2e00nted as mean ± SEM. N = 11; hepatic
hepatic vein
this figure legend, the reader is referred to the web version of this article.)
100
50
400 200
tHDCA 150
portal vein+aorta
HDCA
glucose and insulin peaked within the first hour and, subsequently, returned
00
0 60 120 180 240 0 60 120 180 240
Transhepatic bile acid kinetics
3
uptake
release
uptake release
to baseline in 4 h. As expected, the concentrations of both glucose and insulin
time (min) time (min)
C Liver flux - major bile acids D Liver flux - minor bile acids
were highest in the portal vein, since glucose and insulin directly appear here
0 50
postprandial from the intestine and pancreas, respectively (AUC glucose mmol/L
0 -50
one-way ANOVA: portal 2143 ± 90 vs hepatic 1744 ± 119, arterial 1727 ± 85,
-200
renal 1629 ± 92 and venous 1571 ± 80; p < 0.0001. AUC insulin mmol/L one-way
-150
-400
-100
ANOVA: portal 162 ± 14 vs hepatic 104 ± 12, arterial 88 ± 8 and venous: 81 ± 9; p
-600 -200
0 60 120 180 240 0 60 120 180 240
time (min) time (min)
< 0.0001). Fig. 2C,D show that glucose and insulin transorgan fluxes in the fasted
state (i.e., t = 0) were low, except for the positive liver flux, which reflects hepatic glucose output. Transhepatic glucose flux increased initially, but subsequently decreased to zero within 1 h. Therefore, after administration of the meal, hepatic glucose production may have continued for a brief period. Together with glucose from the portal drained viscera (PDV, i.e., intestine and pancreas), this resulted in a substantial postprandial glucose peak in the peripheral circulation. Insulin flux across the liver was negative which demonstrates hepatic insulin clearance.
53
