
Page 54 - Human Bile Acid Metabolism: a Postprandial Perspective
P. 54
Chapter 3
Detected numeric outliers were excluded based on Grubbs’ test. Data are presented as mean ± standard error of the mean (SEM).
Results
Glucose and insulin concentrations and transorgan fluxes validate
the porcine model
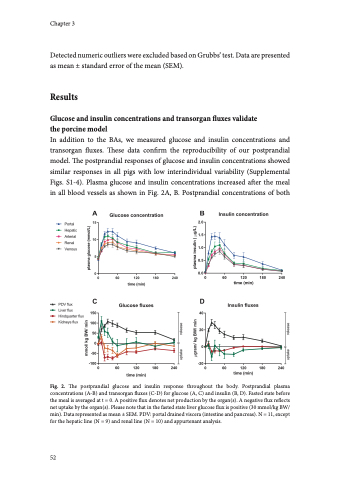
In addition to the BAs, we measured glucose and insulin concentrations and transorgan fluxes. These data confirm the reproducibility of our postprandial model. The postprandial responses of glucose and insulin concentrations showed similar responses in all pigs with low interindividual variability (Supplemental Figs. S1-4). Plasma glucose and insulin concentrations increased after the meal in all blood vessels as shown in Fig. 2A, B. Postprandial concentrations of both
Fig. 2. The postprandial glucose and insulin response throughout the body. Postprandial plasma concentrations (A-B) and transorgan fluxes (C-D) for glucose (A, C) and insulin (B, D). Fasted state before the meal is averaged at t = 0. A positive flux denotes net production by the organ(s). A negative flux reflects net uptake by the organ(s). Please note that in the fasted state liver glucose flux is positive (30 mmol/kg BW/ min). Data represented as mean ± SEM. PDV: portal drained viscera (intestine and pancreas). N = 11, except for the hepatic line (N = 9) and renal line (N = 10) and appurtenant analysis.
52
