
Page 44 - When surgery alone won’t cut it - Valerie Maureen Monpellier
P. 44
Chapter 2
three studies self-reported binge eaters had lower weight loss 29,57,70 and in two there was no difference 40,43.
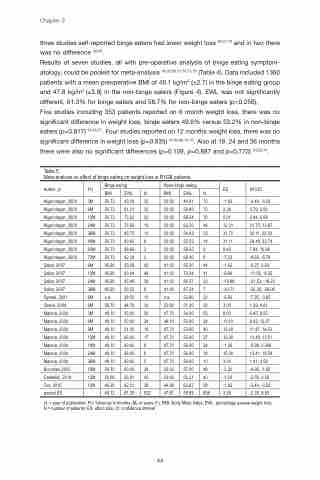
Results of seven studies, all with pre-operative analysis of binge eating symptom- atology, could be pooled for meta-analysis 54,55,66,71,74,75,79 (Table 4). Data included 1360 patients with a mean preoperative BMI of 49.1 kg/m2 (±2.7) in the binge eating group and 47.8 kg/m2 (±3.8) in the non-binge eaters (Figure 4). EWL was not significantly different, 61.3% for binge eaters and 58.7% for non-binge eaters (p=0.256).
Five studies including 353 patients reported on 6 month weight loss, there was no significant difference in weight loss, binge eaters 49.6% versus 53.2% in non-binge eaters (p=0.817) 54,55,71. Four studies reported on 12 months weight loss, there was no significant difference in weight loss (p=0.935) 54,55,66,74,75. Also at 18, 24 and 36 months there were also no significant differences (p=0.109, p=0.887 and p=0.773) 54,55,74.
Table 5:
Meta-analysis on effect of binge eating on weight loss in RYGB patients
Author, yr.
Alger-mayer, 2009 Alger-mayer, 2009 Alger-mayer, 2009 Alger-mayer, 2009 Alger-mayer, 2009 Alger-mayer, 2009 Alger-mayer, 2009 Alger-mayer, 2009 Sallet, 2007 Sallet, 2007 Sallet, 2007 Sallet, 2007 Dymek, 2001 Green, 2004 Malone, 2004 Malone, 2004 Malone, 2004 Malone, 2004 Malone, 2004 Malone, 2004 Malone, 2004 Bocchieri,2002 Castellini, 2014 Fox, 2015
pooled ES
95%CI
-3.40, -0.26 0.79, 3.93 3.44, 6.58 10.75, 13.87 30.11, 33.33 29.49, 32.74 7.94, 10.96 -8.65, -5.78 -3.27, 0.03 -11.55, -8.25 -21.53, -18.23 -32.36, -29.06 -7.25, -3.95 1.39, 4.61 6.45, 9.55 9.43, 12.57 11.47, 14.53 10.49, 13.51 -2.99, 0.266 13.41, 16.59 1.41, 4.59 -4.95, -1.65 -2.59, 0.59 -3.40, -0.26 -2.35, 8.83
FU
Binge eating
None binge eating
ES
BMI
EWL
N
BMI
EWL
N
3M
50.73
43.08
32
50.92
44.91
70
-1.83
6M
50.73
61.21
32
50.92
58.85
70
2.36
12M
50.73
73.25
32
50.92
68.24
70
5.01
24M
50.73
75.56
19
50.92
63.25
44
12.31
36M
50.73
85.75
13
50.92
54.03
23
31.72
48M
50.73
83.65
9
50.92
52.53
14
31.11
60M
50.73
68.69
3
50.92
59.25
9
9.45
72M
50.73
62.24
2
50.92
69.46
8
-7.22
6M
45.90
53.58
43
41.60
55.20
44
-1.62
12M
45.90
63.44
44
41.60
73.34
41
-9.90
24M
45.90
65.49
34
41.60
85.37
33
-19.88
36M
45.90
56.53
8
41.60
87.24
7
-30.71
6M
n.a.
38.50
10
n.a.
53.90
22
-5.60
6M
56.70
44.78
33
52.80
51.20
32
3.00
3M
48.10
33.00
26
47.70
34.00
52
8.00
6M
48.10
50.00
24
48.10
50.00
24
11.00
9M
48.10
61.00
16
47.70
53.00
40
13.00
12M
48.10
66.00
17
47.70
55.00
37
12.00
18M
48.10
69.00
9
47.70
56.00
24
-1.36
24M
48.10
68.00
6
47.70
56.00
18
15.00
36M
48.10
69.00
5
47.70
54.00
10
3.00
18M
54.70
60.00
24
53.60
57.00
48
-3.30
12M
50.66
56.91
43
53.60
60.21
40
-1.00
12M
46.30
62.31
38
44.99
63.67
58
-1.83
49.12
61.29
522
47.81
58.99
838
3.24
yr. = year of publication; FU: follow-up in months (M) or years (Y); BMI: Body Mass Index; EWL: percentage excess weight loss; N = number of patients; ES: effect size; CI: confidence interval
44
