
Page 107 - When surgery alone won’t cut it - Valerie Maureen Monpellier
P. 107
Mean number of body parts affected by overhanging skin ranged was 2.7 (Table 2). In the desire-group, 3.1 body parts were affected, compared to 1.7 in the no de- sire-group (p<0.001). Most affected were abdomen (72.5%), inside of thighs (50.0%), upper arms (46.1%) and breasts/chest (43.4%). The abdomen was also the most desired body part for BCS (n=250, 58.8%).
The mean PRS grade for abdomen was highest in all patients (Table 2). The de- sire-group had a significantly higher PRS grade for the abdomen (2.0±0.5), compared to the BCS-group (1.6±1.0, p<0.001) and the no desire-group (1.6±0.6, p<0.001). Rat- ing for flank (1.4±0.9) and breasts (1.5±0.7) in the desire-group were significantly high- er than in the no desire-group; respectively, 0.9±0.9 (p<0.001) and 1.0±0.9 (p<0.001). For the arms, the desire-group gave the same rating as the BCS-group (1.7±0.8); these scores were significantly higher than in the no desire-group (1.2±0.8, p<0.001 in both).
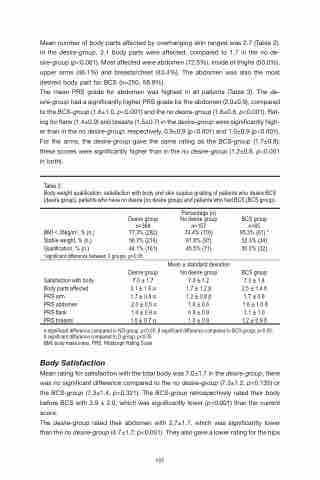
Table 2:
Body weight qualification, satisfaction with body and skin surplus grading of patients who desire BCS (desire group), patients who have no desire (no desire group) and patients who had BCS (BCS group).
BMI < 35kg/m2, % (n.)
Stable weight, % (n.)
Qualification, % (n.)
*significant difference between 3 groups, p<0.05
Desire group n=368 77.3% (282)
Percentage (n) No desire group n=157 74.4% (116) 61.8% (97) 45.5% (71)
Mean ± standard deviation No desire group
7.3 ± 1.2
1.7 ± 1.2 β
1.2 ± 0.8 β
1.6 ± 0.6
0.9 ± 0.9
1.0 ± 0.9
BCS group n=65 95.3% (61) *
52.3% (34) 50.0% (32)
BCS group 7.3 ± 1.4 2.5 ± 1.4 δ 1.7 ± 0.8
1.6 ± 1.0 δ 1.1 ± 1.0 1.2 ± 0.9 δ
58.7% (216) 44.1% (161)
Satisfaction with body Body parts affected PRS arm
PRS abdomen
PRS flank PRS breasts
Desire group 7.0 ± 1.7 3.1 ± 1.6 α 1.7 ± 0.8 α
2.0 ± 0.5 α 1.4 ± 0.9 α 1.5 ± 0.7 α
α significant difference compared to ND-group, p<0.05; β significant difference compared to BCS-group, p<0.05; δ significant difference compared to D-group, p<0.05
BMI: body mass index, PRS: Pittsburgh Rating Scale
Body Satisfaction
Mean rating for satisfaction with the total body was 7.0±1.7 in the desire-group, there was no significant difference compared to the no desire-group (7.3±1.2, p=0.135) or the BCS-group (7.3±1.4, p=0.321). The BCS-group retrospectively rated their body before BCS with 3.9 ± 2.0, which was significantly lower (p<0.001) than the current score.
The desire-group rated their abdomen with 2.7±1.7, which was significantly lower than the no desire-group (4.7±1.7; p<0.001). They also gave a lower rating for the hips
107
