
Page 106 - When surgery alone won’t cut it - Valerie Maureen Monpellier
P. 106
Chapter 6
p=0.029).
In the desire-group the rate of unemployment was higher (34.9%) compared to the no desire-group (26.1%, p=0.026). There were also significantly more patients with an income below median (64.6%) in the desire-group, compared the BCS-group (55.6%) and to the no desire-group (48.6%, p=0.017). Unemployment was lowest in the BCS- group (24.6%, p=0.026). There were no significant differences in education level.
Body weight
Follow-up was not significantly different between the three groups, nor was type of bariatric procedure (Table 1). Current BMI was lowest in the BCS-group, 27.6 kg/m2, versus 31.1 kg/m2 in the desire-group (p<0.001) and 31.3 kg/m2 in the no desire-group (p<0.001).
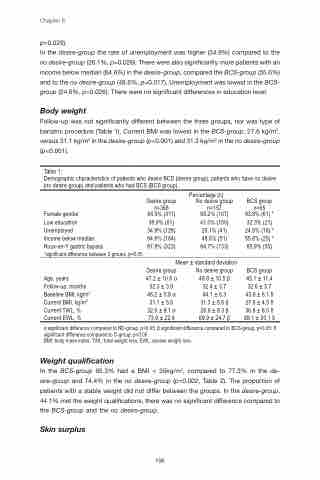
Table 1:
Demographic characteristics of patients who desire BCS (desire group), patients who have no desire (no desire group) and patients who had BCS (BCS group).
Female gender
Low education
Unemployed
Income below median
Roux-en-Y gastric bypass
*significant difference between 3 groups, p<0.05
Age, years Follow-up, months Baseline BMI, kg/m2 Current BMI, kg/m2 Current TWL, % Current EWL, %
Desire group n=368 84.5% (311)
38.9% (61) 34.9% (128) 64.6% (164) 87.8% (323)
Percentage (n)
No desire group
n=157 68.2% (107)
41.0% (150) 26.1% (41) 48.6% (51) 84.7% (133)
BCS group n=65 93.8% (61) *
32.3% (21) 24.6% (16) * 55.6% (25) * 85.9% (55)
BCS group 45.1 ± 11.4 32.6 ± 3.7 43.9 ± 6.1 δ 27.6 ± 4.5 δ 36.8 ± 8.0 δ 89.1 ± 20.1 δ
Mean ± standard deviation
Desire group 47.2 ± 10.6 α 32.3 ± 3.9 46.2 ± 5.8 α 31.1 ± 5.6 32.6 ± 9.1 α 73.9 ± 22.6
No desire group 49.8 ± 10.5 β 32.4 ± 3.7 44.1 ± 6.3 31.3 ± 5.6 β 28.9 ± 9.3 β 69.9 ± 24.7 β
α significant difference compared to ND-group, p<0.05; β significant difference compared to BCS-group, p<0.05; δ significant difference compared to D-group, p<0.05.
BMI: body mass index; TWL: total weight loss, EWL: excess weight loss.
Weight qualification
In the BCS-group 95.3% had a BMI < 35kg/m2, compared to 77.3% in the de- sire-group and 74.4% in the no desire-group (p=0.002, Table 2). The proportion of patients with a stable weight did not differ between the groups. In the desire-group, 44.1% met the weight qualifications, there was no significant difference compared to the BCS-group and the no desire-group.
Skin surplus
106
