
Page 48 - Demo
P. 48
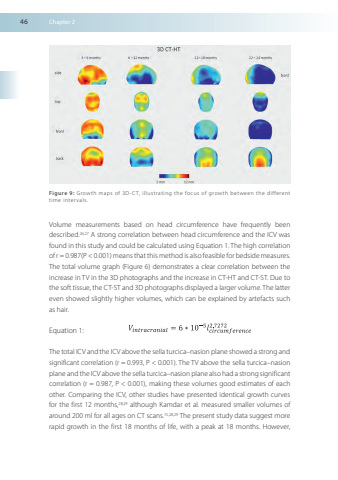
46Chapter2Figure9Growthmapsof3D-CTillustratingthefocusofgrowthbetweenthedifferenttimeintervalsVolumemeasurementsbasedonheadcircumferencehavefrequentlybeendescribed2627AstrongcorrelationbetweenheadcircumferenceandtheICVwasfoundinthisstudyandcouldbecalculatedusingEquation1 Thehighcorrelationofr= 0987(P< 0001)means that thismethodis also feasible forbedsidemeasuresThetotalvolumegraph(Figure6)demonstratesaclearcorrelationbetweentheincreasein TVinthe3DphotographsandtheincreaseinCT-HTandCT-ST.Duetothesoft tissue theCT-STand3Dphotographsdisplayedalarger volume ThelatterevenshowedslightlyhighervolumeswhichcanbeexplainedbyartefactssuchashairEquation1The totalICV and theICV above the sella turcica–nasionplane showed a strong andsignificantcorrelation(r=0993P<0001) The TVabovethesellaturcica–nasionplane and theICV above the sella turcica–nasionplane alsohad a strong significantcorrelation(r=0987P<0001)makingthesevolumesgoodestimatesofeachotherComparingtheICV,otherstudieshavepresentedidenticalgrowthcurvesforthefirst12months2829althoughKamdaretalmeasuredsmallervolumesofaround200mlforallagesonCTscans152829 Thepresentstudydatasuggestmorerapidgrowthinthefirst18monthsoflifewithapeakat18monthsHowever,
