
Page 45 - Movers, Shapers, and Everything in Between: Influencers of the International Student Experience
P. 45
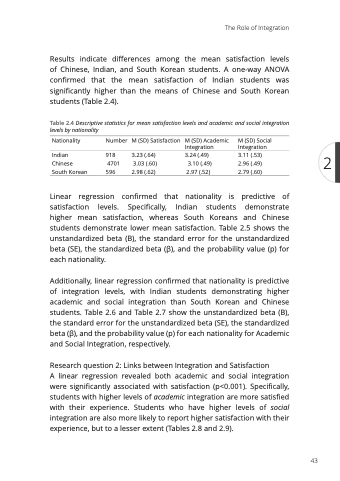
Results indicate differences among the mean satisfaction levels of Chinese, Indian, and South Korean students. A one-way ANOVA confirmed that the mean satisfaction of Indian students was significantly higher than the means of Chinese and South Korean students (Table 2.4).
Table 2.4 Descriptive statistics for mean satisfaction levels and academic and social integration levels by nationality
The Role of Integration
 Nationality
Indian Chinese South Korean
Number M (SD) Satisfaction
918 3.23 (.64) 4701 3.03 (.60)
596 2.98 (.62)
M (SD) Academic Integration
3.24 (.49) 3.10 (.49)
2.97 (.52)
M (SD) Social Integration
3.11 (.53) 2.96 (.49) 2.79 (.60)
2
    Linear regression confirmed that nationality is predictive of satisfaction levels. Specifically, Indian students demonstrate higher mean satisfaction, whereas South Koreans and Chinese students demonstrate lower mean satisfaction. Table 2.5 shows the unstandardized beta (B), the standard error for the unstandardized beta (SE), the standardized beta (β), and the probability value (p) for each nationality.
Additionally, linear regression confirmed that nationality is predictive of integration levels, with Indian students demonstrating higher academic and social integration than South Korean and Chinese students. Table 2.6 and Table 2.7 show the unstandardized beta (B), the standard error for the unstandardized beta (SE), the standardized beta (β), and the probability value (p) for each nationality for Academic and Social Integration, respectively.
Research question 2: Links between Integration and Satisfaction
A linear regression revealed both academic and social integration were significantly associated with satisfaction (p<0.001). Specifically, students with higher levels of academic integration are more satisfied with their experience. Students who have higher levels of social integration are also more likely to report higher satisfaction with their experience, but to a lesser extent (Tables 2.8 and 2.9).
43
