
Page 44 - Movers, Shapers, and Everything in Between: Influencers of the International Student Experience
P. 44
Chapter 2
The constructs of academic and social integration emerged from a set of thirteen independent variables selected from the ISB which were evidenced to be valid proxies of integration. Cronbach’s alpha was obtained for each construct, and a chi-square goodness of fit test indicated a p value of <.000, suggesting that the distribution is not due to chance.
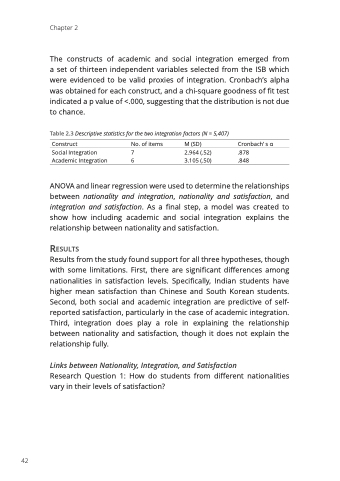
Table 2.3 Descriptive statistics for the two integration factors (N = 5,407)
Construct
Social Integration Academic Integration
No. of items
7 6
M (SD)
2.964 (.52) 3.105 (.50)
Cronbach’ s α
.878 .848
42
ANOVA and linear regression were used to determine the relationships between nationality and integration, nationality and satisfaction, and integration and satisfaction. As a final step, a model was created to show how including academic and social integration explains the relationship between nationality and satisfaction.
reSultS
Results from the study found support for all three hypotheses, though with some limitations. First, there are significant differences among nationalities in satisfaction levels. Specifically, Indian students have higher mean satisfaction than Chinese and South Korean students. Second, both social and academic integration are predictive of self- reported satisfaction, particularly in the case of academic integration. Third, integration does play a role in explaining the relationship between nationality and satisfaction, though it does not explain the relationship fully.
Links between Nationality, Integration, and Satisfaction
Research Question 1: How do students from different nationalities vary in their levels of satisfaction?
