
Page 85 - New epidemiological and PSMA-expression based paradigms in salivary gland tumors
P. 85
Risk of breast cancer after a salivary gland tumor in the Netherlands
5
83
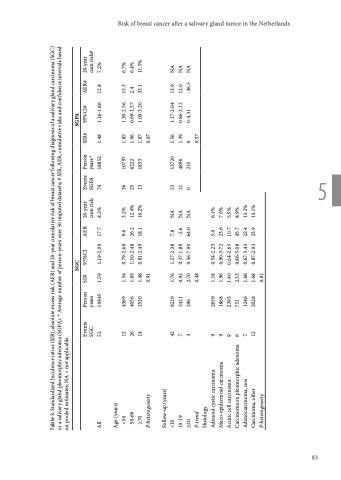
Table 3. Standardized Incidence ratios (SIR), absolute excess risk (AER) and 20-year cumulative risk of breast cancer following diagnosis of a salivary gland carcinoma (SGC) or a salivary gland pleomorphic adenoma (SGPA). * Average number of person-years over 50 imputed datasets; # SIR, AER, cumulative risks and confidence intervals based on pooled estimates; NA = not applicable.
All 52 10945 1.59
17.7 8.2%
74 18852
12.8 7.2%
Age (years)
<50 12 4369 1.54 50-69 26 4056 1.69 ≥70 14 2520 1.48
0.79-2.68 1.10-2.48 0.81-2.49
9.6 3.2% 26.2 12.4% 18.1 16.2%
36 10797 25 6222 13 1833
1.85 1.30-2.56 1.06 0.69-1.57 1.87 1.00-3.20 0.07
15.3 6.7% 2.4 6.4% 33.1 11.5%
P-heterogeneity 0.91
Follow-up (years)
<10 42 8229 1.76 10-19 7 2421 0.92 ≥20 3 296 2.70 P-trend 0.48 Histology
Adenoid cystic carcinoma 9 2659 1.18 Muco-epidermoid carcinoma 9 1868 1.96 Acinic cell carcinoma 9 2393 1.40 Carcinoma ex pleomorphic adenoma 6 751 2.33 Adenocarcinoma, nos 7 1246 1.66 Carcinoma, other 12 2028 1.68 P-heterogeneity 0.81
1.27-2.38 0.37-1.89 0.56-7.90
7.8 NA -2.6 NA 64.0 NA
53 13720 21 4896 0 235
1.56 1.17-2.04 1.39 0.86-2.12 0 0-4.31 0.37
13.9 NA 12.0 NA -36.5 NA
Events Person SIR SGC years
95%CI 1.19-2.09
AER 20-year cum risk
Events Person SGPA years*
SIR# 95%CI# 1.48 1.16-1.86
AER# 20-year cum risk#
SGC
SGPA
0.54-2.23 0.90-3.72 0.64-2.65 0.86-5.08 0.67-3.43 0.87-2.93
5.0 6.1% 23.6 7.0% 10.7 5.5% 45.7 8.9% 22.4 13.2% 23.9 13.1%
