
Page 84 - New epidemiological and PSMA-expression based paradigms in salivary gland tumors
P. 84
Chapter 5
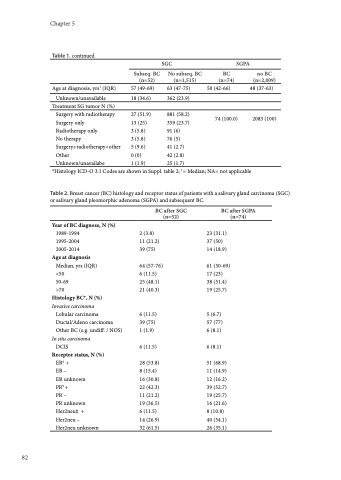
Table 1. continued
Age at diagnosis, yrs† (IQR)
Unknown/unavailable
Treatment SG tumor N (%)
Surgery with radiotherapy Surgery only
Radiotherapy only
No therapy Surgery+radiotherapy+other Other
SGC
No subseq. BC (n=1,515)
63 (47-75)
362 (23.9)
881 (58.2) 359 (23.7) 91 (6)
76 (5)
SGPA
Subseq. BC (n=52)
57 (49-69)
18 (34.6)
27 (51.9) 13 (25)
3 (5.8)
3 (5.8)
BC (n=74)
50 (42-66)
no BC (n=2,009)
48 (37-63)
2083 (100)
5 (9.6) 0 (0)
1 (1.9)
41 (2.7) 42 (2.8) 25 (1.7)
Unknown/unavailabe
*Histology ICD-O 3.1 Codes are shown in Suppl. table 2; † = Median; NA= not applicable
74 (100.0)
Table 2. Breast cancer (BC) histology and receptor status of patients with a salivary gland carcinoma (SGC) or salivary gland pleomorphic adenoma (SGPA) and subsequent BC.
Year of BC diagnose, N (%)
1989-1994 1995-2004 2005-2014
Age at diagnosis
Median, yrs (IQR) <50
50-69
>70
Histology BC*, N (%)
Invasive carcinoma
Lobular carcinoma Ductal/Adeno carcinoma Other BC (e.g. undiff. / NOS)
In situ carcinoma
DCIS
Receptor status, N (%)
ER§ +
ER –
ER unknown
PR¥ +
PR –
PR unknown Her2neu‡ + Her2neu – Her2neu unknown
BC after SGC (n=52)
2 (3.8) 11 (21.2) 39 (75)
64 (57-76) 6 (11.5) 25 (48.1) 21 (40.3)
6 (11.5) 39 (75) 1 (1.9)
6 (11.5)
28 (53.8) 8 (15.4) 16 (30.8) 22 (42.3) 11 (21.2) 19 (36.5) 6 (11.5) 14 (26.9) 32 (61.5)
BC after SGPA (n=74)
23 (31.1) 37 (50) 14 (18.9)
61 (50-69) 17 (23)
38 (51.4) 19 (25.7)
5 (6.7) 57 (77) 6 (8.1)
6 (8.1)
51 (68.9) 11 (14.9) 12 (16.2) 39 (52.7) 19 (25.7) 16 (21.6) 8 (10.8) 40 (54.1) 26 (35.1)
82
