
Page 72 - New epidemiological and PSMA-expression based paradigms in salivary gland tumors
P. 72
Chapter 4
70
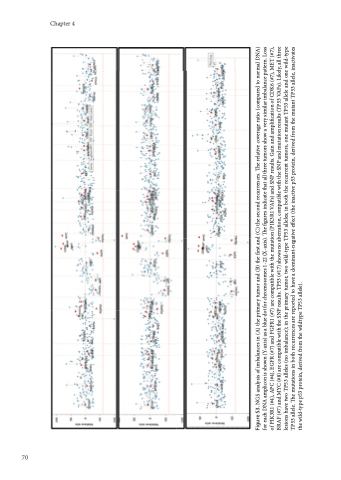
Figure S3. NGS analysis of imbalances in (A) the primary tumor and (B) the first and (C) the second recurrences. The relative coverage ratio (compared to normal DNA) for each DNA amplicon is shown (Y-axis) as a blue dot for chromosomes 1-22 (X-axis). The figures indicate that all three tumors show a very similar imbalance pattern. Loss of PIK3R1 (#4), APC (#4), EGFR (#7) and FGFR1 (#7) are compatible with the mutation (PIK3R1 VAFs) and SNP results. Gain and amplification of CDK6 (#7), MET (#7), BRAF (#7) and MYC (#8) are compatible with the SNP results. TP53 (#17) shows no aberration, compatible with the SNP and mutation results (TP53 VAFs). Likely, all three lesions have two TP53 alleles (no imbalance); in the primary tumor, two wild-type TP53 alleles; in both the recurrent tumors, one mutant TP53 allele and one wild-type TP53 allele. The mutations in both recurrences are reported to have a dominant-negative effect (the inactive p53 protein, derived from the mutant TP53 allele, inactivates the wild-type p53 protein, derived from the wildtype TP53 allele).
