
Page 312 - Personalised medicine of fluoropyrimidines using DPYD pharmacogenetics Carin Lunenburg
P. 312
Chapter 12
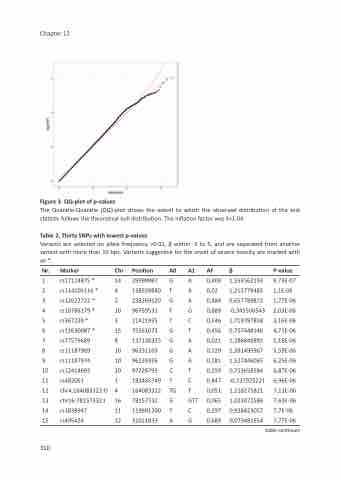
Figure 3. QQ-plot of p-values
The Quantile-Quantile (QQ)-plot shows the extent to which the observed distribution of the test statistic follows the theoretical null distribution. The inflation factor was λ=1.04.
Table 2. Thirty SNPs with lowest p-values
Variants are selected on allele frequency >0.01, β within -5 to 5, and are separated from another variant with more than 10 bps. Variants suggestive for the onset of severe toxicity are marked with an *.
Nr. Marker
1 rs17114875 *
2 rs114105116 *
3 rs12622722
4 rs10786179
5 rs367239 *
6 rs11630087
7 rs77579689
8 rs11187969
9 rs11187974
10 rs12414693
11 rs482061
12 chr4:164083322:D
13 chr16:78157332:I
14 rs1838947
15 rs495426
Chr Position
14 29999987 4 138539880 2 238269120 10 96759531 3 21421935 15 75261673 8 137130325 10 96231169 10 96239326 10 97228795 1 182485749 4 164083322 16 78157332 11 119691200 12 31021833
A0 A1 AF
G A 0,409 T A 0,02 G A 0,484 T G 0,889 T C 0,546 G T 0,456 G A 0,021 G A 0,129 G A 0,181 C T 0,259 T C 0,847 TG T 0,051 G GTT 0,065 T C 0,297 A G 0,689
β
1,554562193 1,213779485 0,657789872 -0,345506543 1,719787858 0,757448146 1,286849892 1,381495967 1,527446065 0,713658584 -0,737925221 1,218271821 1,023072586 0,928423057 0,073481654
P-value
9,73E-07 1,1E-06 1,77E-06 2,03E-06 3,16E-06 4,71E-06 5,18E-06 5,59E-06 6,25E-06 6,87E-06 6,96E-06 7,11E-06 7,63E-06 7,7E-06 7,77E-06
table continues
* *
*
310
