
Page 116 - Exploring the Potential of Self-Monitoring Kidney Function After Transplantation - Céline van Lint
P. 116
114
Chapter 5
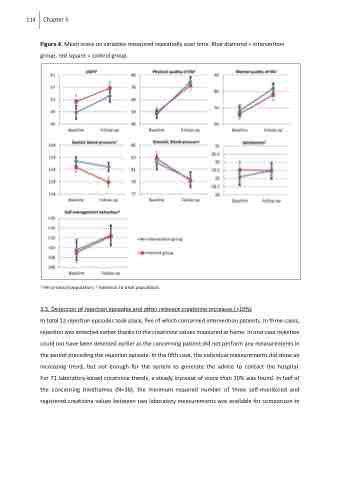
Figure 4. Mean score on variables measured repeatedly over time. Blue diamond = intervention group, red square = control group.
1 Per protocol population; 2 Intention to treat population.
3.5. Detection of rejection episodes and other relevant creatinine increases (>10%)
In total 12 rejection episodes took place, five of which concerned intervention patients. In three cases, rejection was detected earlier thanks to the creatinine values measured at home. In one case rejection could not have been detected earlier as the concerning patient did not perform any measurements in the period preceding the rejection episode. In the fifth case, the individual measurements did show an increasing trend, but not enough for the system to generate the advice to contact the hospital. For 71 laboratory-based creatinine trends, a steady increase of more than 10% was found. In half of the concerning timeframes (N=36), the minimum required number of three self-monitored and registered creatinine values between two laboratory measurements was available for comparison to
